
Querying India's MoSPI Data with Claude and MCP
February 9, 2026
The Ministry of Statistics and Programme Implementation recently released a Model Context Protocol (MCP) server that lets you query their survey data using natural language through LLMs like Claude or ChatGPT. Instead of constructing API calls manually or digging through PDFs, you can ask questions in plain English and get back aggregate statistics from national surveys.
This came on my radar via Harsh Nisar on the Friends of Vizchitra WhatsApp group:
We (Bharat Digital) worked with MOSPI to make this MCP. Now you can connect ChatGPT or Claude to MOSPI’s official MCP and get official statistical data across NAS, PLFS, CPI, WPI, ASI etc directly into your LLM based workflows.
The idea is that open-data should meet users where they are and imagining what the next phase of open-data can look like. More about what we (Bharat Digital) think about this in a blog soon + engineering log on what went behind the scenes!
I think this is an interesting idea and something I am not entirely opposed to. ChatGPT, Claude and Gemini enthusiastically generate “data” and it is almost certainly being used by researchers, journalists and casually interested folks of all calibre, so the possibility that that generated data is more grounded in reality is, in my opinion, a net positive. The purpose of the government is to provide data and not dashboards; anything that increases that specific surface area and doesn’t aim to give us opaque numbers is a step in an acceptable direction. This last point is also the subject of my proposed talk at Vizchitra this year, which, I hope, gets accepted!
Let us see what this is about and try to put it through its paces.
The heck is an MCP?
Before diving into the mechanics of what this is, what it does, and what it doesn’t do, I think some context is useful. Currently, MoSPI provides APIs for macro statistics across roughly 19 surveys, including the NFHS, the Time Use Survey, and PLFS. To be clear: this API returns the aggregated numbers used in reports, not the raw microdata with all its multipliers and so on (which, while downloadable, isn’t what this endpoint serves).
Utilizing this API requires going through its documentation to map codes to indicators or figure out how to specify parameters like gender, state etc. The Model Context Protocol (MCP) acts as a wrapper around this, bridging the gap between an LLM agent and the hard API.
The MCP does not generate data, the point is that you no longer need to construct the technical query. You can input a fuzzy natural language question, for example., “How has the mortality rate changed in rural India over the last five years?”, and the MCP handles the translation. It identifies the relevant dataset (in this case, NFHS), constructs the call, pings the internal API, and returns the data. It is only a natural language interface for MoSPI’s existing infrastructure.
My goal here is to demonstrate how it functions with a few queries so you can get a sense of what is and isn’t possible. At the time of writing, 7 surveys are available for querying through the MCP. The ability to add MCPs seems to be available for on free plans for both Claude and ChatGPT. However, on free plans you might run out your limit faster because this uses more tokens (how LLM providers measure your usage) than a usual chat.
I’ll be using this with Claude Web. Set-up with Claude was simple, just adding https://mcp.mospi.gov.in as a custom connector (in the Connectors Settings). Side note, but damn, getting that subdomain must have been an internal battle in itself.
According to the MoSPI website, you can even set this up with ChatGPT. I don’t use ChatGPT, but there should be nothing different in usage.
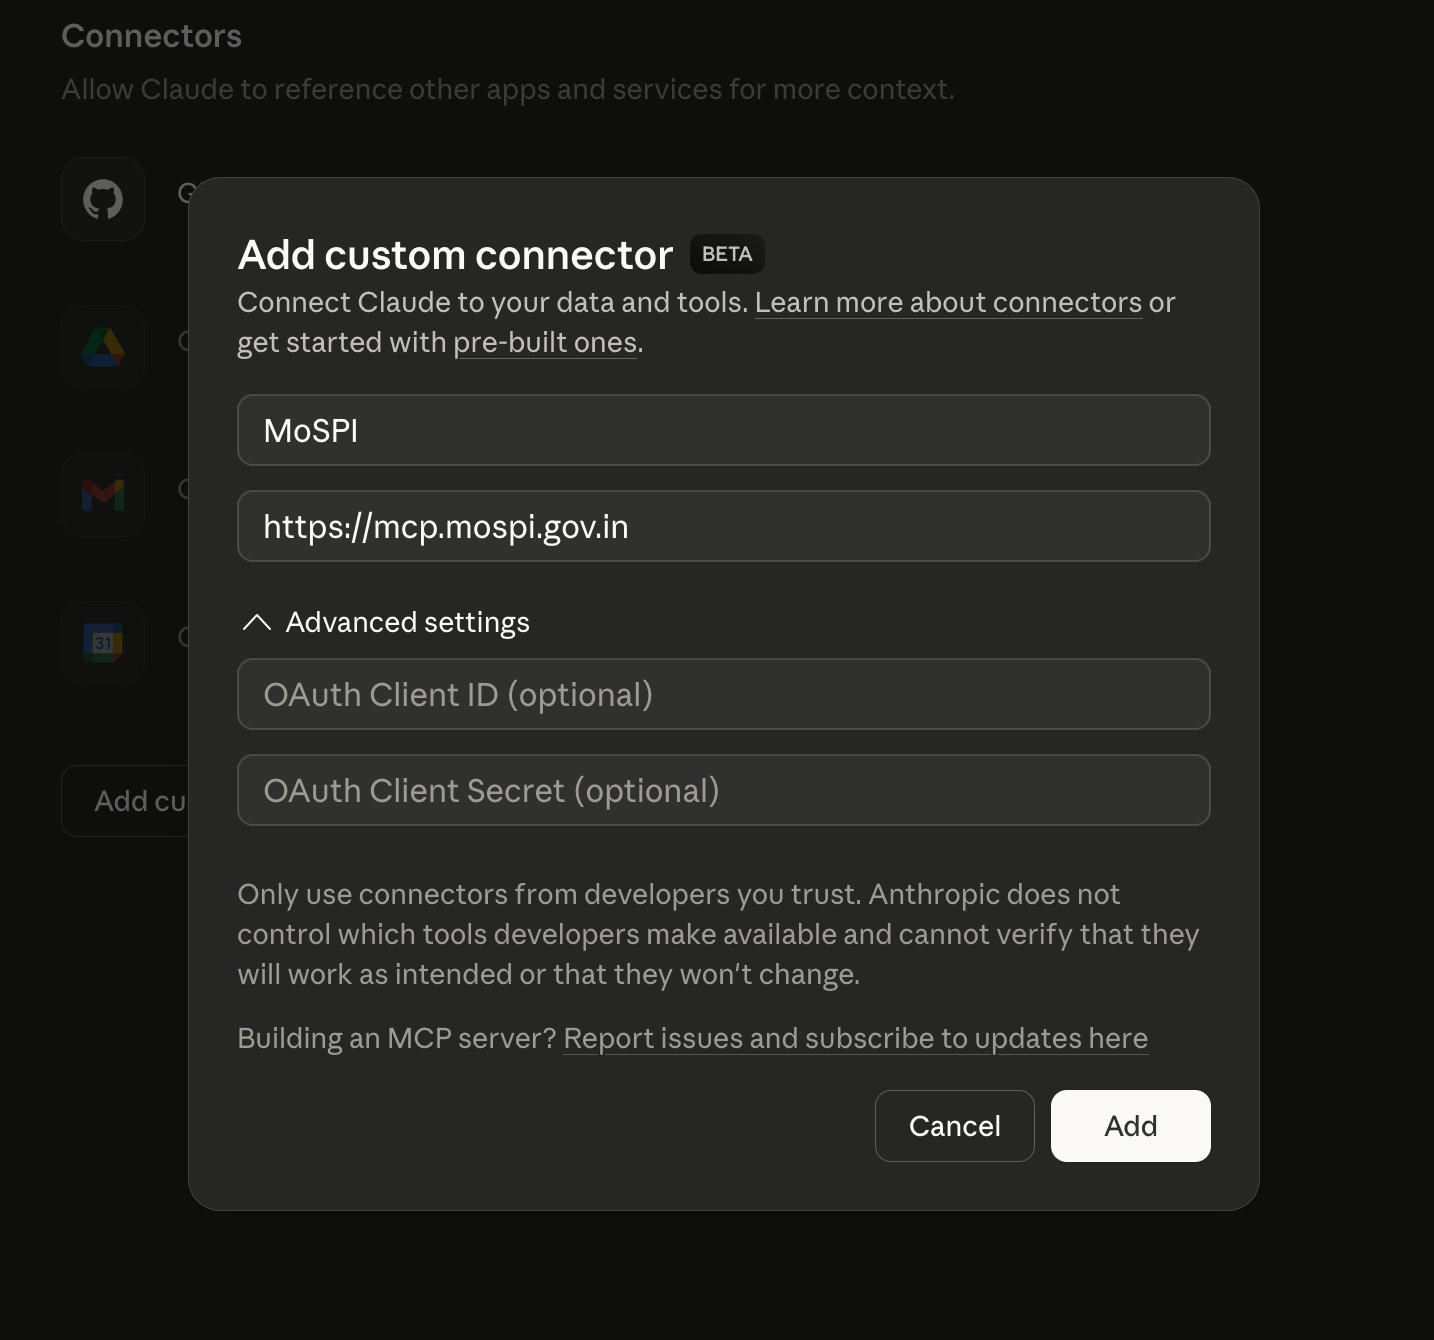
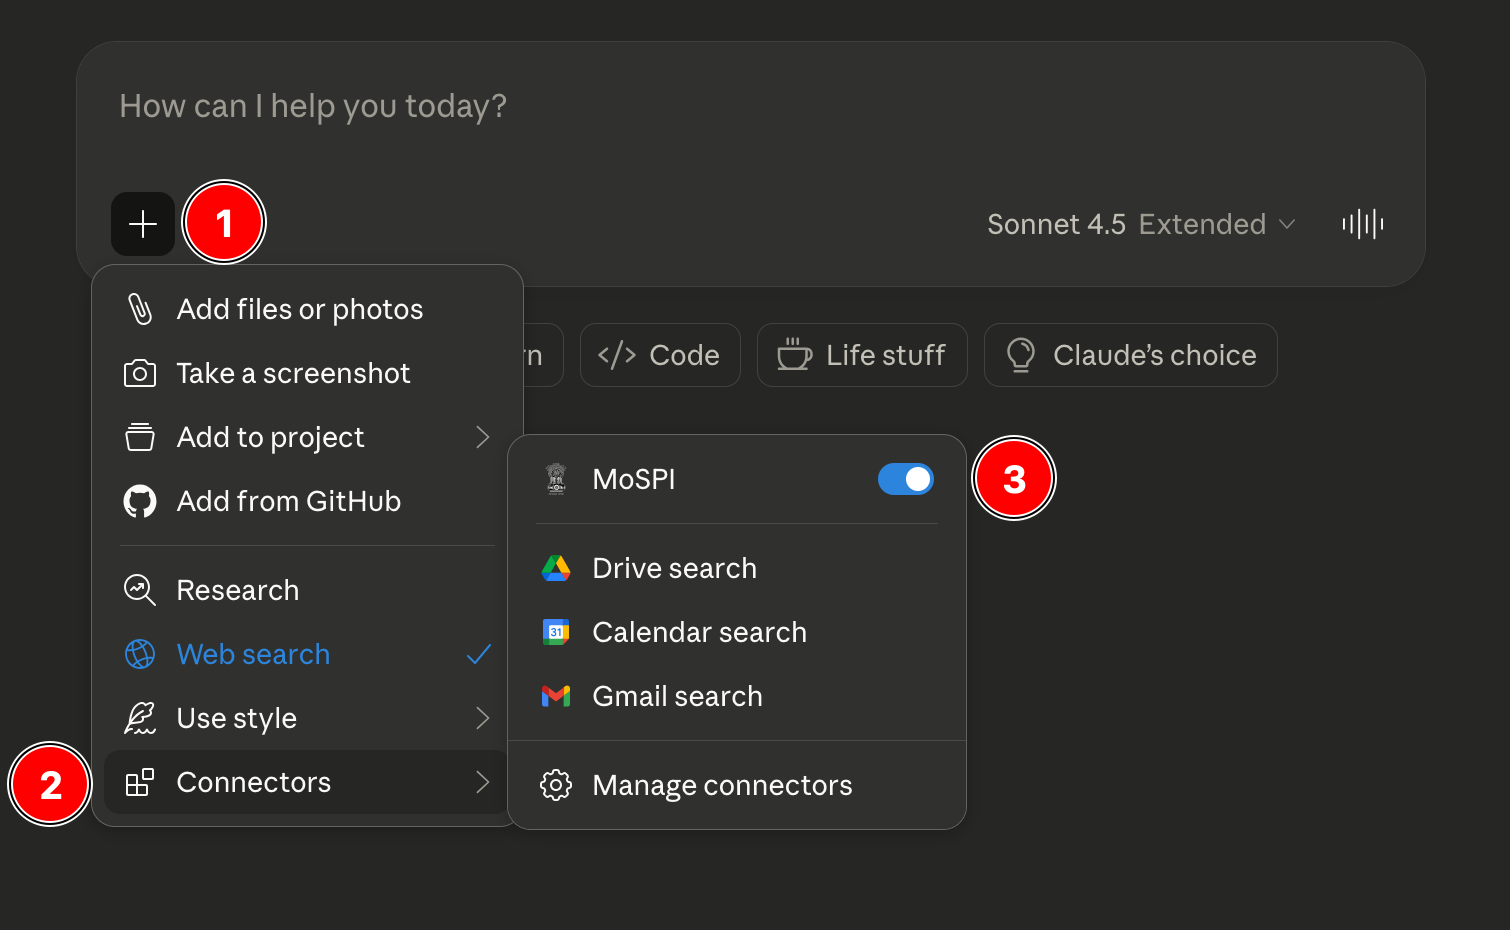
Once this is added, the MCP/Connector is available in the chat by default but you can enable or disable it by clicking on the + icon.
Testing
Let’s try some possible queries. We’ll start with a simple one.
Finding Inflation Figures
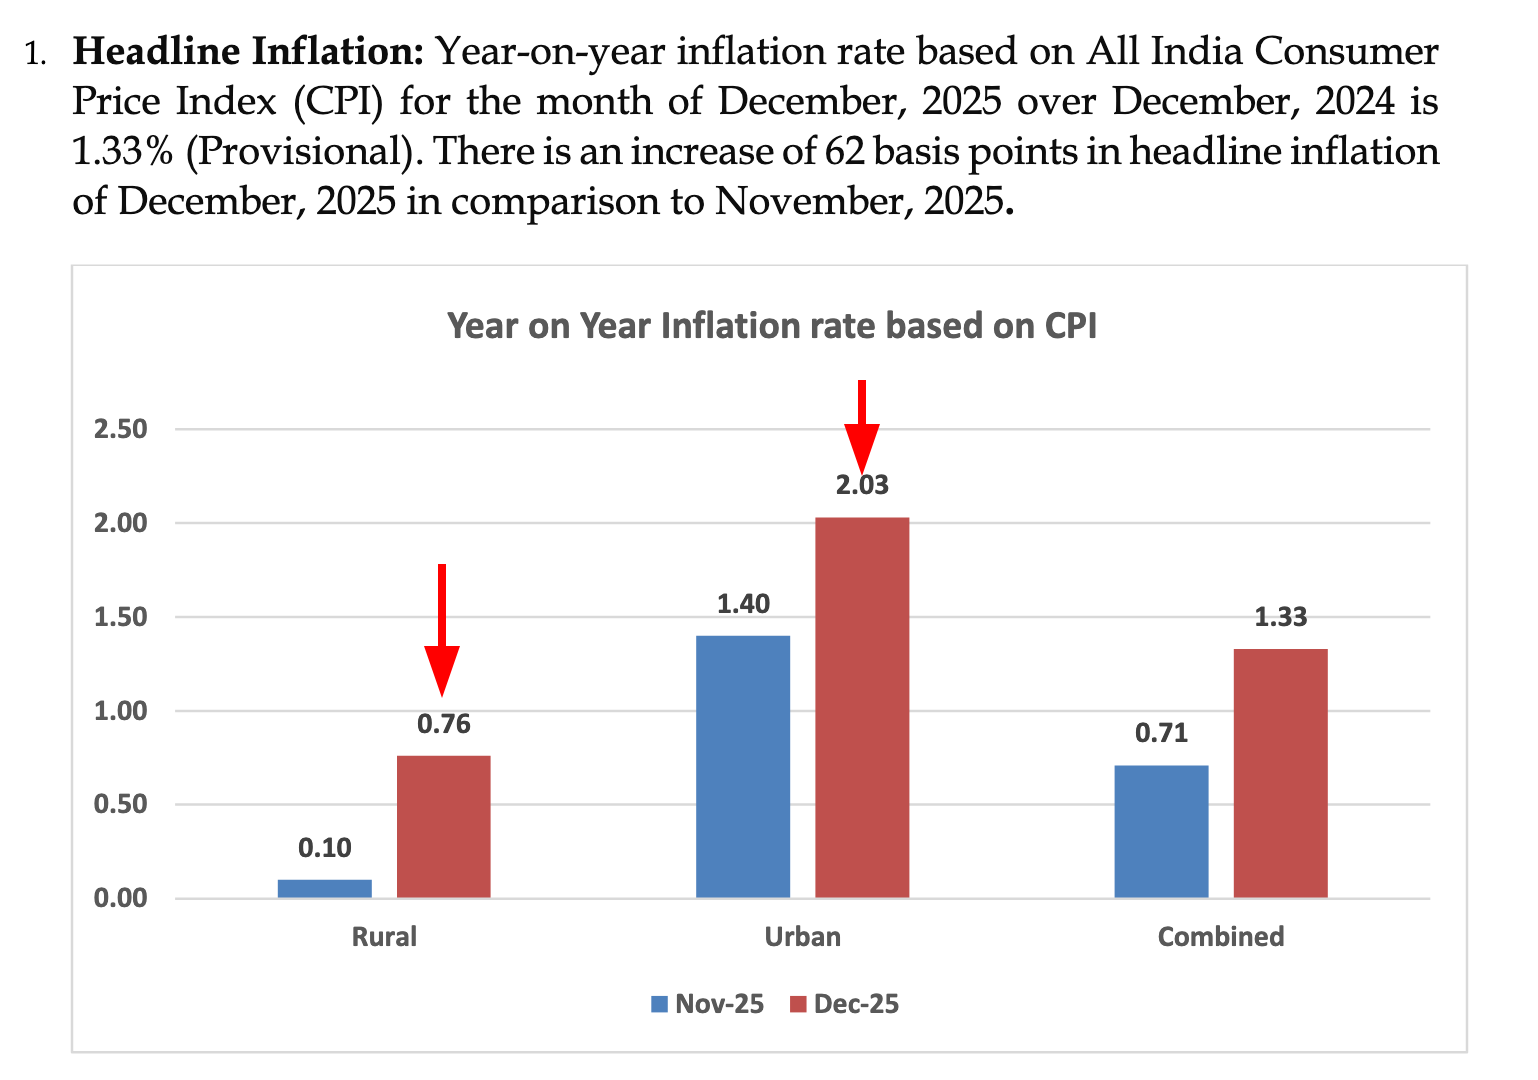
I begin with asking what are the “Latest headline inflation figures for rural and urban India?” This is a fairly simple query which you should probably just search for because the first response would be MoSPI’s own press release, but we can start with this to see how Claude arrives at a number we can easily verify.
When I type that prompt into Claude, the first thing it does is realize it doesn’t actually know the answer off the top of its head. It knows it has a tool, which is the MoSPI MCP, and it starts a conversation with it. From the chat:
The user is asking for the latest headline inflation figure for Rural and Urban India as of December 2025. This is a specific data request about Indian inflation statistics.

Headline inflation typically refers to the overall inflation rate, which in India is measured by the Consumer Price Index (CPI). The MoSPI (Ministry of Statistics and Programme Implementation) API includes CPI data, so I should use that to find the most recent inflation figures.

Let me follow the workflow:

1. First, call 1_know_about_mospi_api() to understand the datasets
2. Then call 2_get_indicators() for the CPI dataset
3. Call 3_get_metadata() to understand the available filters
4. Finally call 4_get_data() to get the actual inflation data

Let me start with step 1.
First, it “calls” 1_know_about_mospi_api() just to see what surveys are available. It gets back a list of datasets, which I have simplified below to show you what Claude looks at.
If you are looking at this format for the first time, it is what is called a JSON response. JSON is a format for storing data, and Claude is communicating with the MoSPI server internally through this structure. You never have to deal with this, which is what the sell is. I show this here just to explain what is going on inside.
You can see how it scans the use_for fields to make a decision and figure out that “CPI” (Consumer Price Index) is the correct dataset for inflation figures.
{ "total_datasets": 7, "datasets": { "PLFS": { "name": "Periodic Labour Force Survey", "use_for": "Jobs, unemployment, wages..." }, "CPI": { "name": "Consumer Price Index", "use_for": "Retail inflation, price indices, cost of living..." }, "IIP": { "name": "Index of Industrial Production", "use_for": "Industrial production, mining, electricity..." }, "WPI": { "name": "Wholesale Price Index", "use_for": "Wholesale inflation, producer prices..." } }}This also comes with a set of rules and next steps that explicitly forbids the LLM from using its creative (read: garbage spouting) capabilities. If it tries to skip a step or guess a code, these rules force it back into the correct lane:
{ "workflow": [ "1. 1_know_about_mospi_api() → find dataset (MANDATORY first step)", "2. 2_get_indicators(dataset) → list indicators", "3. 3_get_metadata(dataset, indicator_code) → get filter values (MANDATORY before step 4)", "4. 4_get_data(dataset, filters) → fetch data (MUST use values from step 3, MUST NOT guess)" ], "rules": [ "NEVER claim data is unavailable, needs computation, or requires special access — ALWAYS call 2_get_indicators() first to check. Your knowledge about MoSPI is outdated; the API has more indicators than you expect.", "MUST NOT skip 3_get_metadata() — filter codes are arbitrary and differ across datasets", "MUST NOT guess filter codes — use ONLY values from 3_get_metadata()", "MUST include frequency_code for PLFS in 4_get_data()", "Comma-separated values work for multiple codes (e.g., '1,2,3')", "ALWAYS attempt to fetch data. NEVER explain limitations or refuse without trying the full workflow first.", "You MUST try the full workflow before concluding. If data is not found after trying, you MUST say honestly 'Data not found in MoSPI API'. You MUST NOT fall back to web search, MUST NOT fabricate data, MUST NOT cite external sources." ], "_next_step": "Call 2_get_indicators(dataset) with the dataset that matches the user's query."}Next, Claude attempts to ask for the “indicators” for the CPI dataset. Notice what happens here:
// Request{ "dataset": "CPI", "user_query": "latest headline inflation figure for Rural and Urban India as of December 2025"}//Response{ "message": "CPI uses levels (Group/Item) instead of indicators. Call 3_get_metadata with base_year and level params.", "_next_step": "Call 3_get_metadata() with the matching indicator and required dataset params. MUST NOT skip to 4_get_data."}The MCP corrects the LLM and guides it to the correct next step, which is fetching metadata with a level parameter, enforcing the API’s specific logic so that we don’t have to do it ourselves. Properly oriented, Claude calls 3_get_metadata with "level": "Group" (since headline inflation is an aggregate group, not a specific “Item” like ‘Onions’). We get a response:
{ "year": [ {"year": 2025, "series": "Current"}, {"year": 2024, "series": "Current"}, // ... ], "month": [ // ... {"month_code": 11, "month_name": "November"}, {"month_code": 12, "month_name": "December"} ], "state": [ {"state_code": 99, "state_name": "All India"}, // ... (States 1-36) ], "sector": [ {"sector_code": 1, "sector_name": "Rural"}, {"sector_code": 2, "sector_name": "Urban"}, {"sector_code": 3, "sector_name": "Combined"} ], "group": [ {"group_code": "0", "group_name": "General"}, // Claude identifies this as "Headline" {"group_code": "1", "group_name": "Food and Beverages"}, // ... ]}It receives a massive JSON dump containing all the valid codes for the API. It has to sift through this to find the keys that translate our English request into this dataset’s language.
- December =
month_code: 12 - All India =
state_code: 99 - Headline Inflation =
group_code: 0(General) - Rural & Urban =
sector_code: 1,2
Now that it is confident in its understanding of the structure required, Claude sends a precise, technical request to the MoSPI server. This is the 4_get_data fetch call. It constructs a JSON query that looks something like this:
{ "dataset": "CPI", "filters": { "year": "2025", "month_code": "12", "state_code": "99", "sector_code": "1,2", "group_code": "0" }}To which the server responds:
{ "data": [ { "baseyear": "2012", "year": 2025, "month": "December", "state": "All India", "sector": "Rural", "group": "General", "subgroup": "General-Overall", "index": "199.9", "inflation": "0.76", "status": "P" }, { "baseyear": "2012", "year": 2025, "month": "December", "state": "All India", "sector": "Urban", "group": "General", "subgroup": "General-Overall", "index": "195.9", "inflation": "2.03", "status": "P" } ], "msg": "Data fetched successfully"}Claude takes these raw JSON objects and synthesizes the final answer:
"Rural India: 0.76%, Urban India: 2.03%."If we compare it with the MoSPI press release, we find that the numbers match.
You idiot! Going through 4 steps and 1-2 minutes of waiting for an LLM to answer when googling this took you exactly 30 seconds!!
That is a valid complaint and for stuff like this, I would also request you to not be seduced by the ease of the chat-box but take 30 seconds out to learn how to Google things properly. Searching is a skill! But this simplified example was to showcase how this process happens. Let’s try asking one more question which is not directly Google-able but usually inside PDFs.
Bihar Unemployment Rate
We will try asking Claude to “Get the unemployment rate for the state of Bihar for the latest available quarter.” There are some ambiguous things here. What is the latest available quarter? What is the code for Bihar? We’ll let the LLM figure this out.
Claude tries to figure these details out (extract from the chat):
Good! Now I can see the quarterly data. The metadata shows:

- Years available: 2017-18 through 2025-26
- Quarter codes:
    - 2: JUL-SEP
    - 3: OCT-DEC
    - 4: JAN-MAR
    - 5: APR-JUN
- Bihar state_code: 4

The latest year is 2025-26, but we're currently in February 2026 (as mentioned in the system prompt). So the latest complete quarter would likely be:

- For 2024-25: Quarter 4 (JAN-MAR 2025) would be the latest complete quarter for that year
- For 2025-26: We're in February 2026, so we're currently in Quarter 4 (JAN-MAR) of the 2025-26 financial year
Some more ‘thinking’ later, comes up with this answer:
Based on the latest available data from the Periodic Labour Force Survey (PLFS), the unemployment rate for Bihar is: 4.8% (July-September 2025 quarter)Comparing this to the Quarterly Bulletin PDF released by MoSPI, which has a table showing the statewise breakdown of this data.
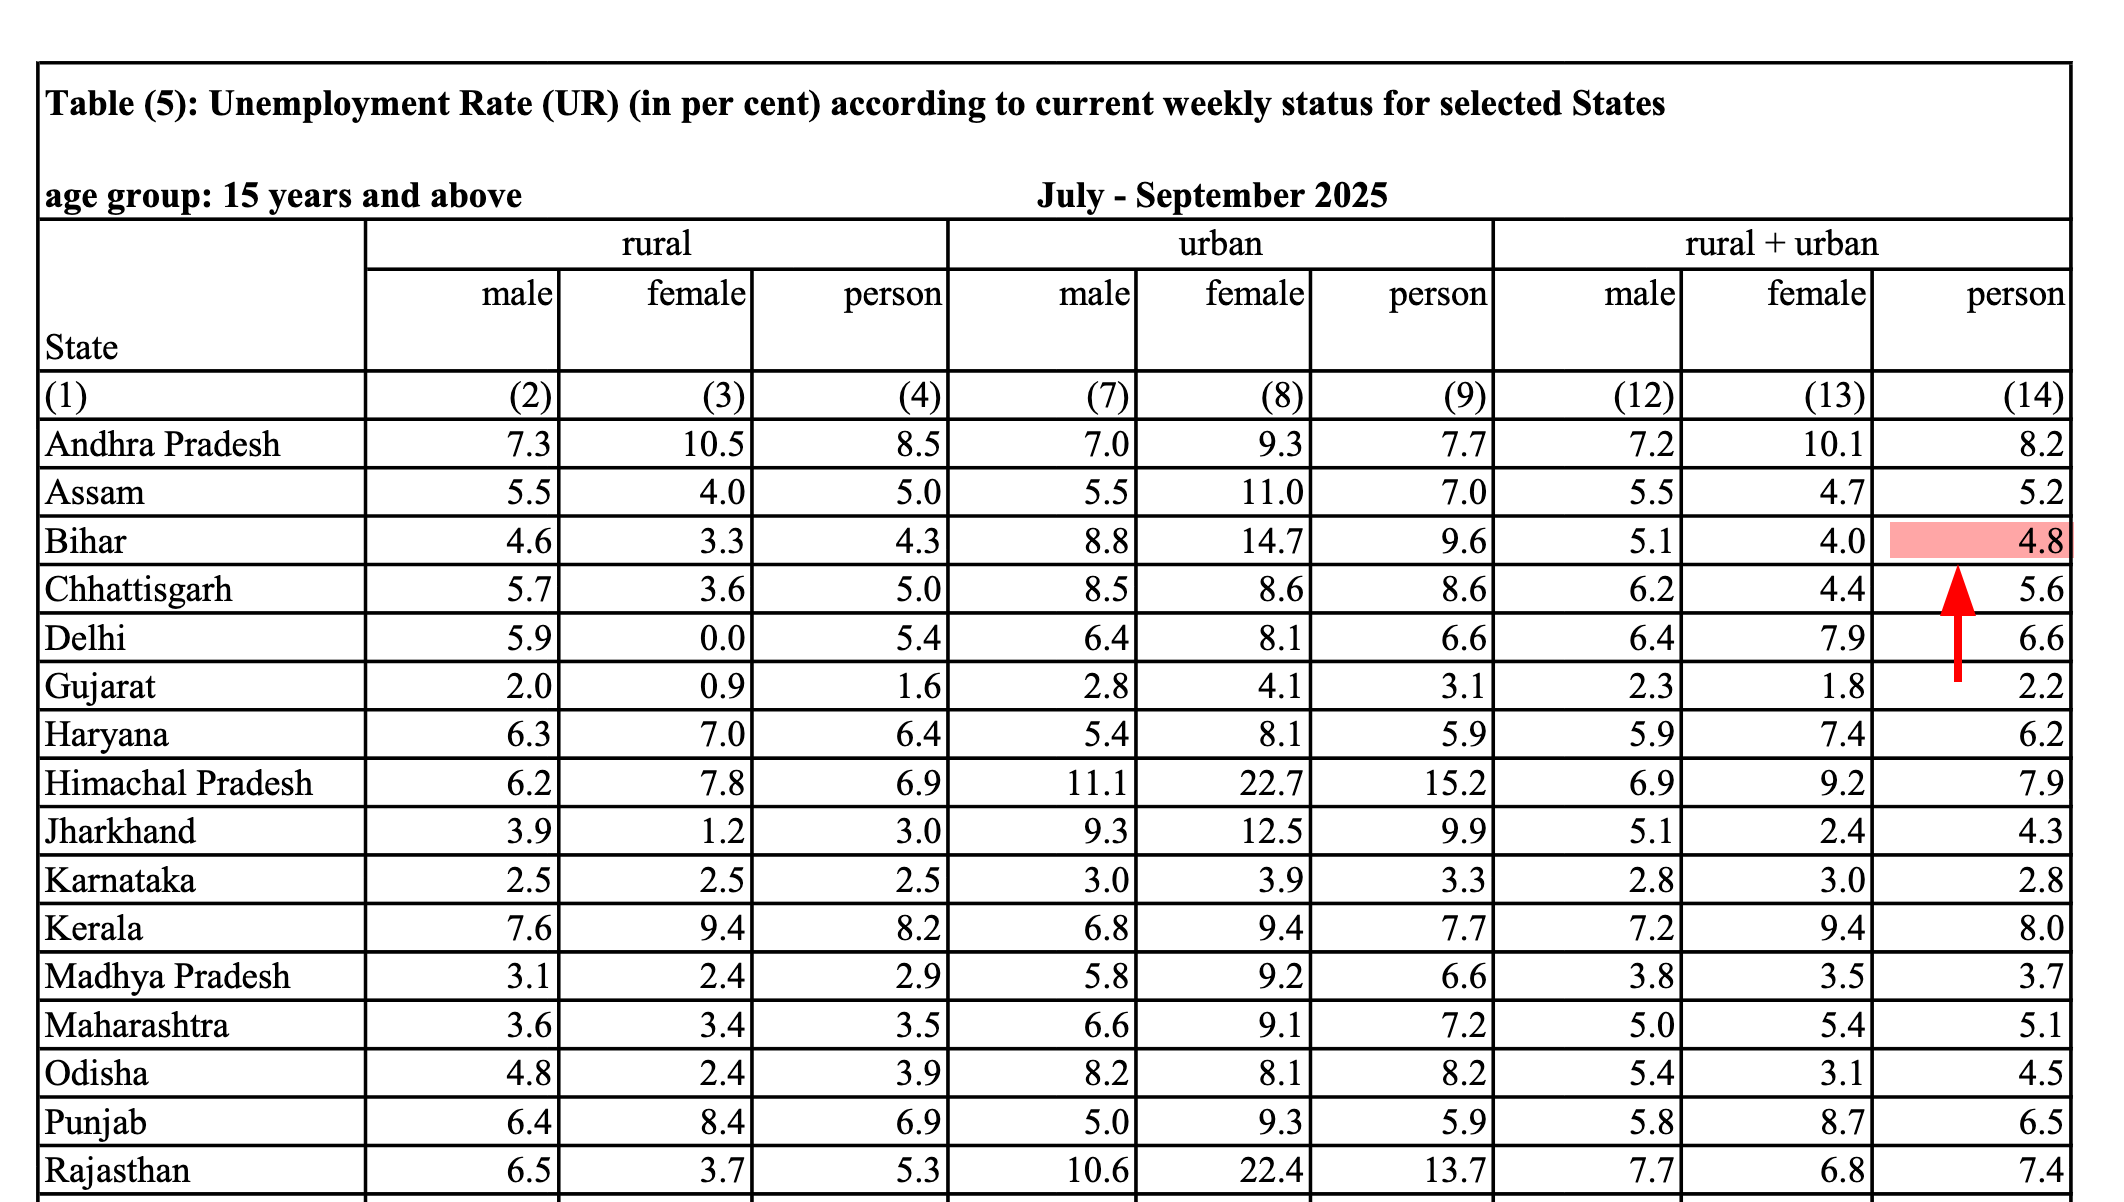
The numbers match! This was one step vaguer than the previous question, although still not “hard”. Once you become more familiar with these documents and have a sense of what to look for and where, perhaps it becomes easier to search for this manually, but so far Claude has given us correct answers for these questions. We’ll try one more.
Wholesale Price Index comparison
WPI measures the average change of wholesale prices of goods. Suppose that we’re interested not in one value, like in previous examples, but a comparison of a specific category of articles across different years?
For this example, let us suppose that we want to track changes in the WPI for textile manufacturing between August 2023 and August 2024. If I was not familiar with handling the WPI dataset on my own and did not want to use a statistics or spreadsheet software, I would have to make two separate searches here to find these data points. My first search is for WPI "textiles" "august 2023" on Google (these " operators help me narrow down the search), which leads me to this press release having this information at the bottom of the page. I would then repeat the search but for 2024 and find this press release.
This was the response from Claude using the MoSPI MCP:
WPI for Manufacture of Textiles:
 - August 2024: 135.9
 - August 2023: 134.1

 This indicates a modest rise in wholesale prices for textile manufacturing between August 2023 and August 2024.
Good enough, maybe? We could even try asking it to compile data for all available years for this group. Which I did.
| Year | Month | WPI Index |
|---|---|---|
| 2013 | January | 104.8 |
| 2013 | February | 105.7 |
| 2014 | April | 114.2 |
| 2014 | May | 115.0 |
| 2015 | August | 109.7 |
| 2015 | September | 109.1 |
| 2016 | - | - |
| 2017 | November | 112.9 |
| 2017 | December | 113.2 |
| … | … | … |
Here, we hit a constraint. Claude noted:
This table shows only the months where I found group-level aggregate data… The dataset contains monthly data for all years, but I sampled strategically across the 5,280 total records.
This data was sampled by Claude itself, so it took a call as to what to find and how much. I suppose I could let it run longer, but ideally this should be a provision within the MCP itself.
I see this as the most useful feature of such a tool: helping people assemble, filter and subset data from these large surveys. This is a far safer and more valid use case than asking an LLM to “find insights” or extrapolate trends from numbers it might barely understand. But at the moment retrieving such large subsets doesn’t seem to be possible.
Charting Unemployment
The data assembly can be taken further by prompting the LLM to plot trends for a certain indicator. Here, I ask it to “plot trends in unemployment rates by gender”. While the chart itself is nothing great to look at, it is something. Plus, you always get the code to make this chart (usually Python) that you can take away and tweak for yourself. Similar analysis in The Hindu.
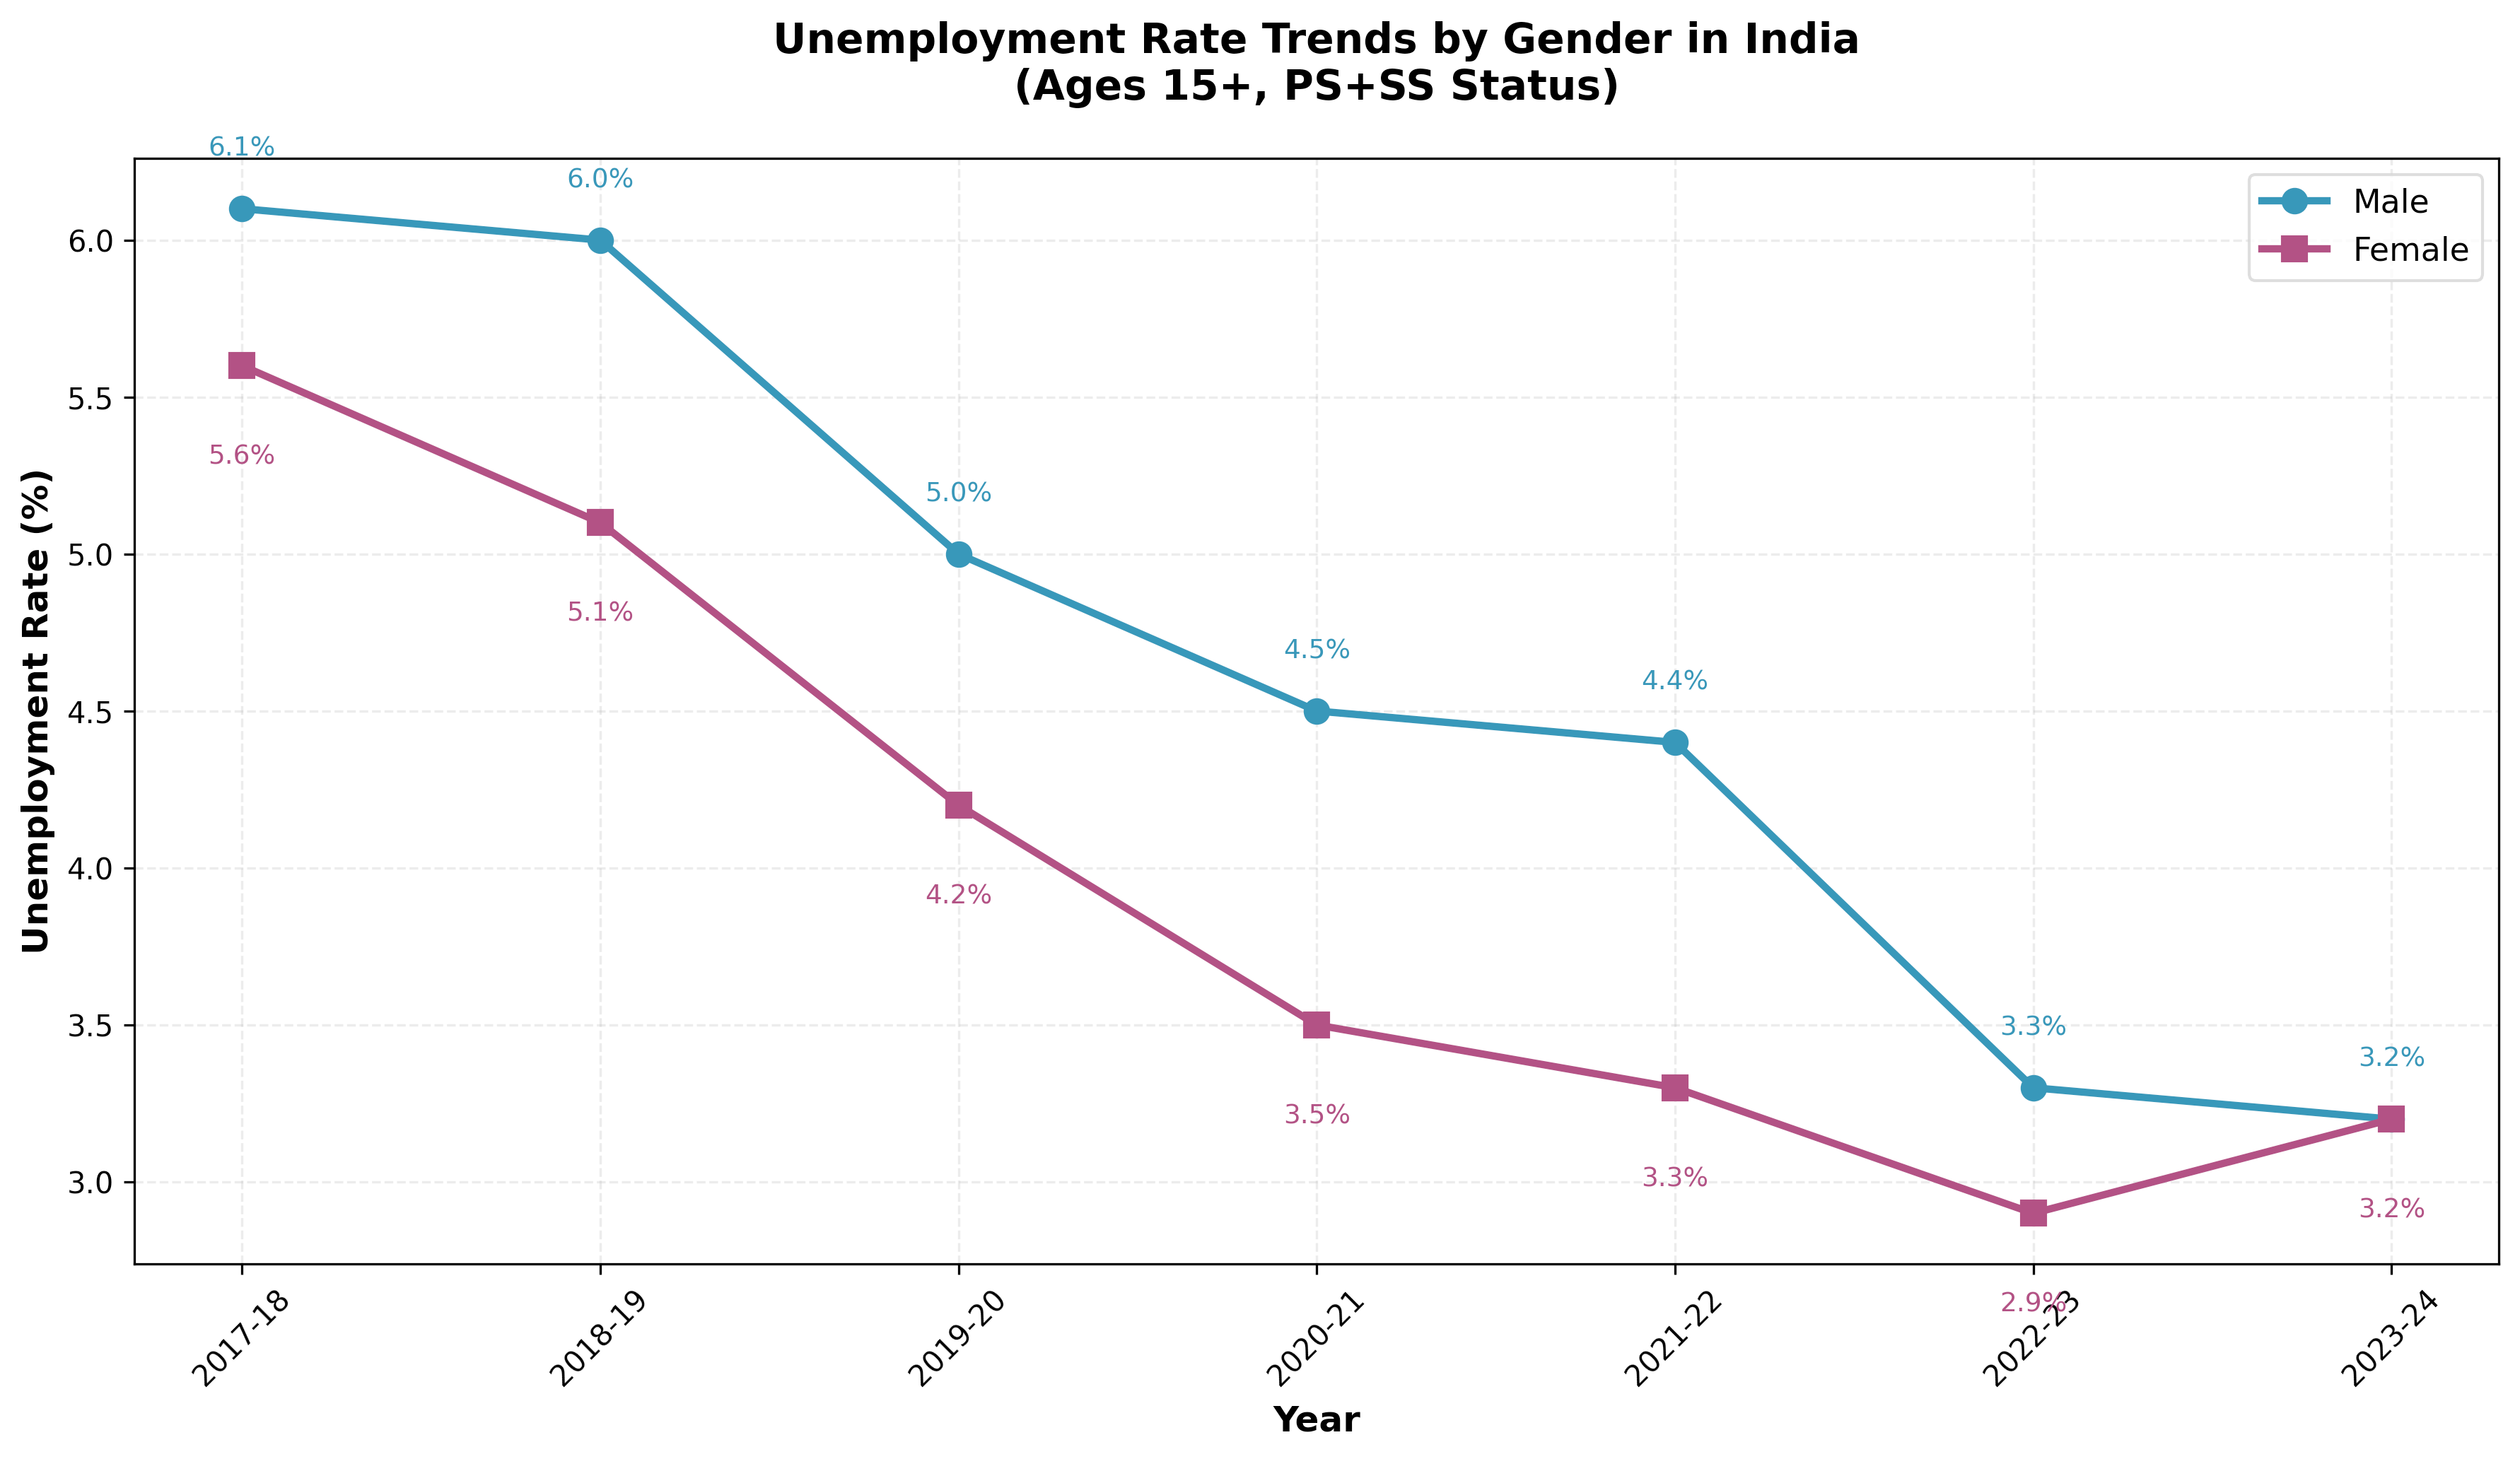
Making the chart is not the hard part though, I still think the fact that it assembled the data is more useful. Along with this chart, it gives me a summary of these numbers:
1. Declining Trend: Both male and female unemployment rates have declined significantly over the 7-year period
	- Male: decreased from 6.1% (2017-18) to 3.2% (2023-24) — a drop of 2.9 percentage points
	- Female: decreased from 5.6% (2017-18) to 3.2% (2023-24) — a drop of 2.4 percentage points

2. Gender Gap Converged: The unemployment rates for males and females converged to the same level (3.2%) in 2023-24, completely closing the gender gap that existed in earlier years
This is just a summary of numerical changes it observed from the data that was returned.
Charting Cross-Survey Data
As a final exercise, I tried getting this to plot data from two different surveys; NAS (National Accounts Statistics) which contains GDP and growth rate data and PLFS which contains unemployment rate data. My prompt was “How does GDP growth correlate with unemployment rates over the past 10 years? Plot the chart.”
Claude here goes overboard and after a few minutes of working, outputs this graphic:
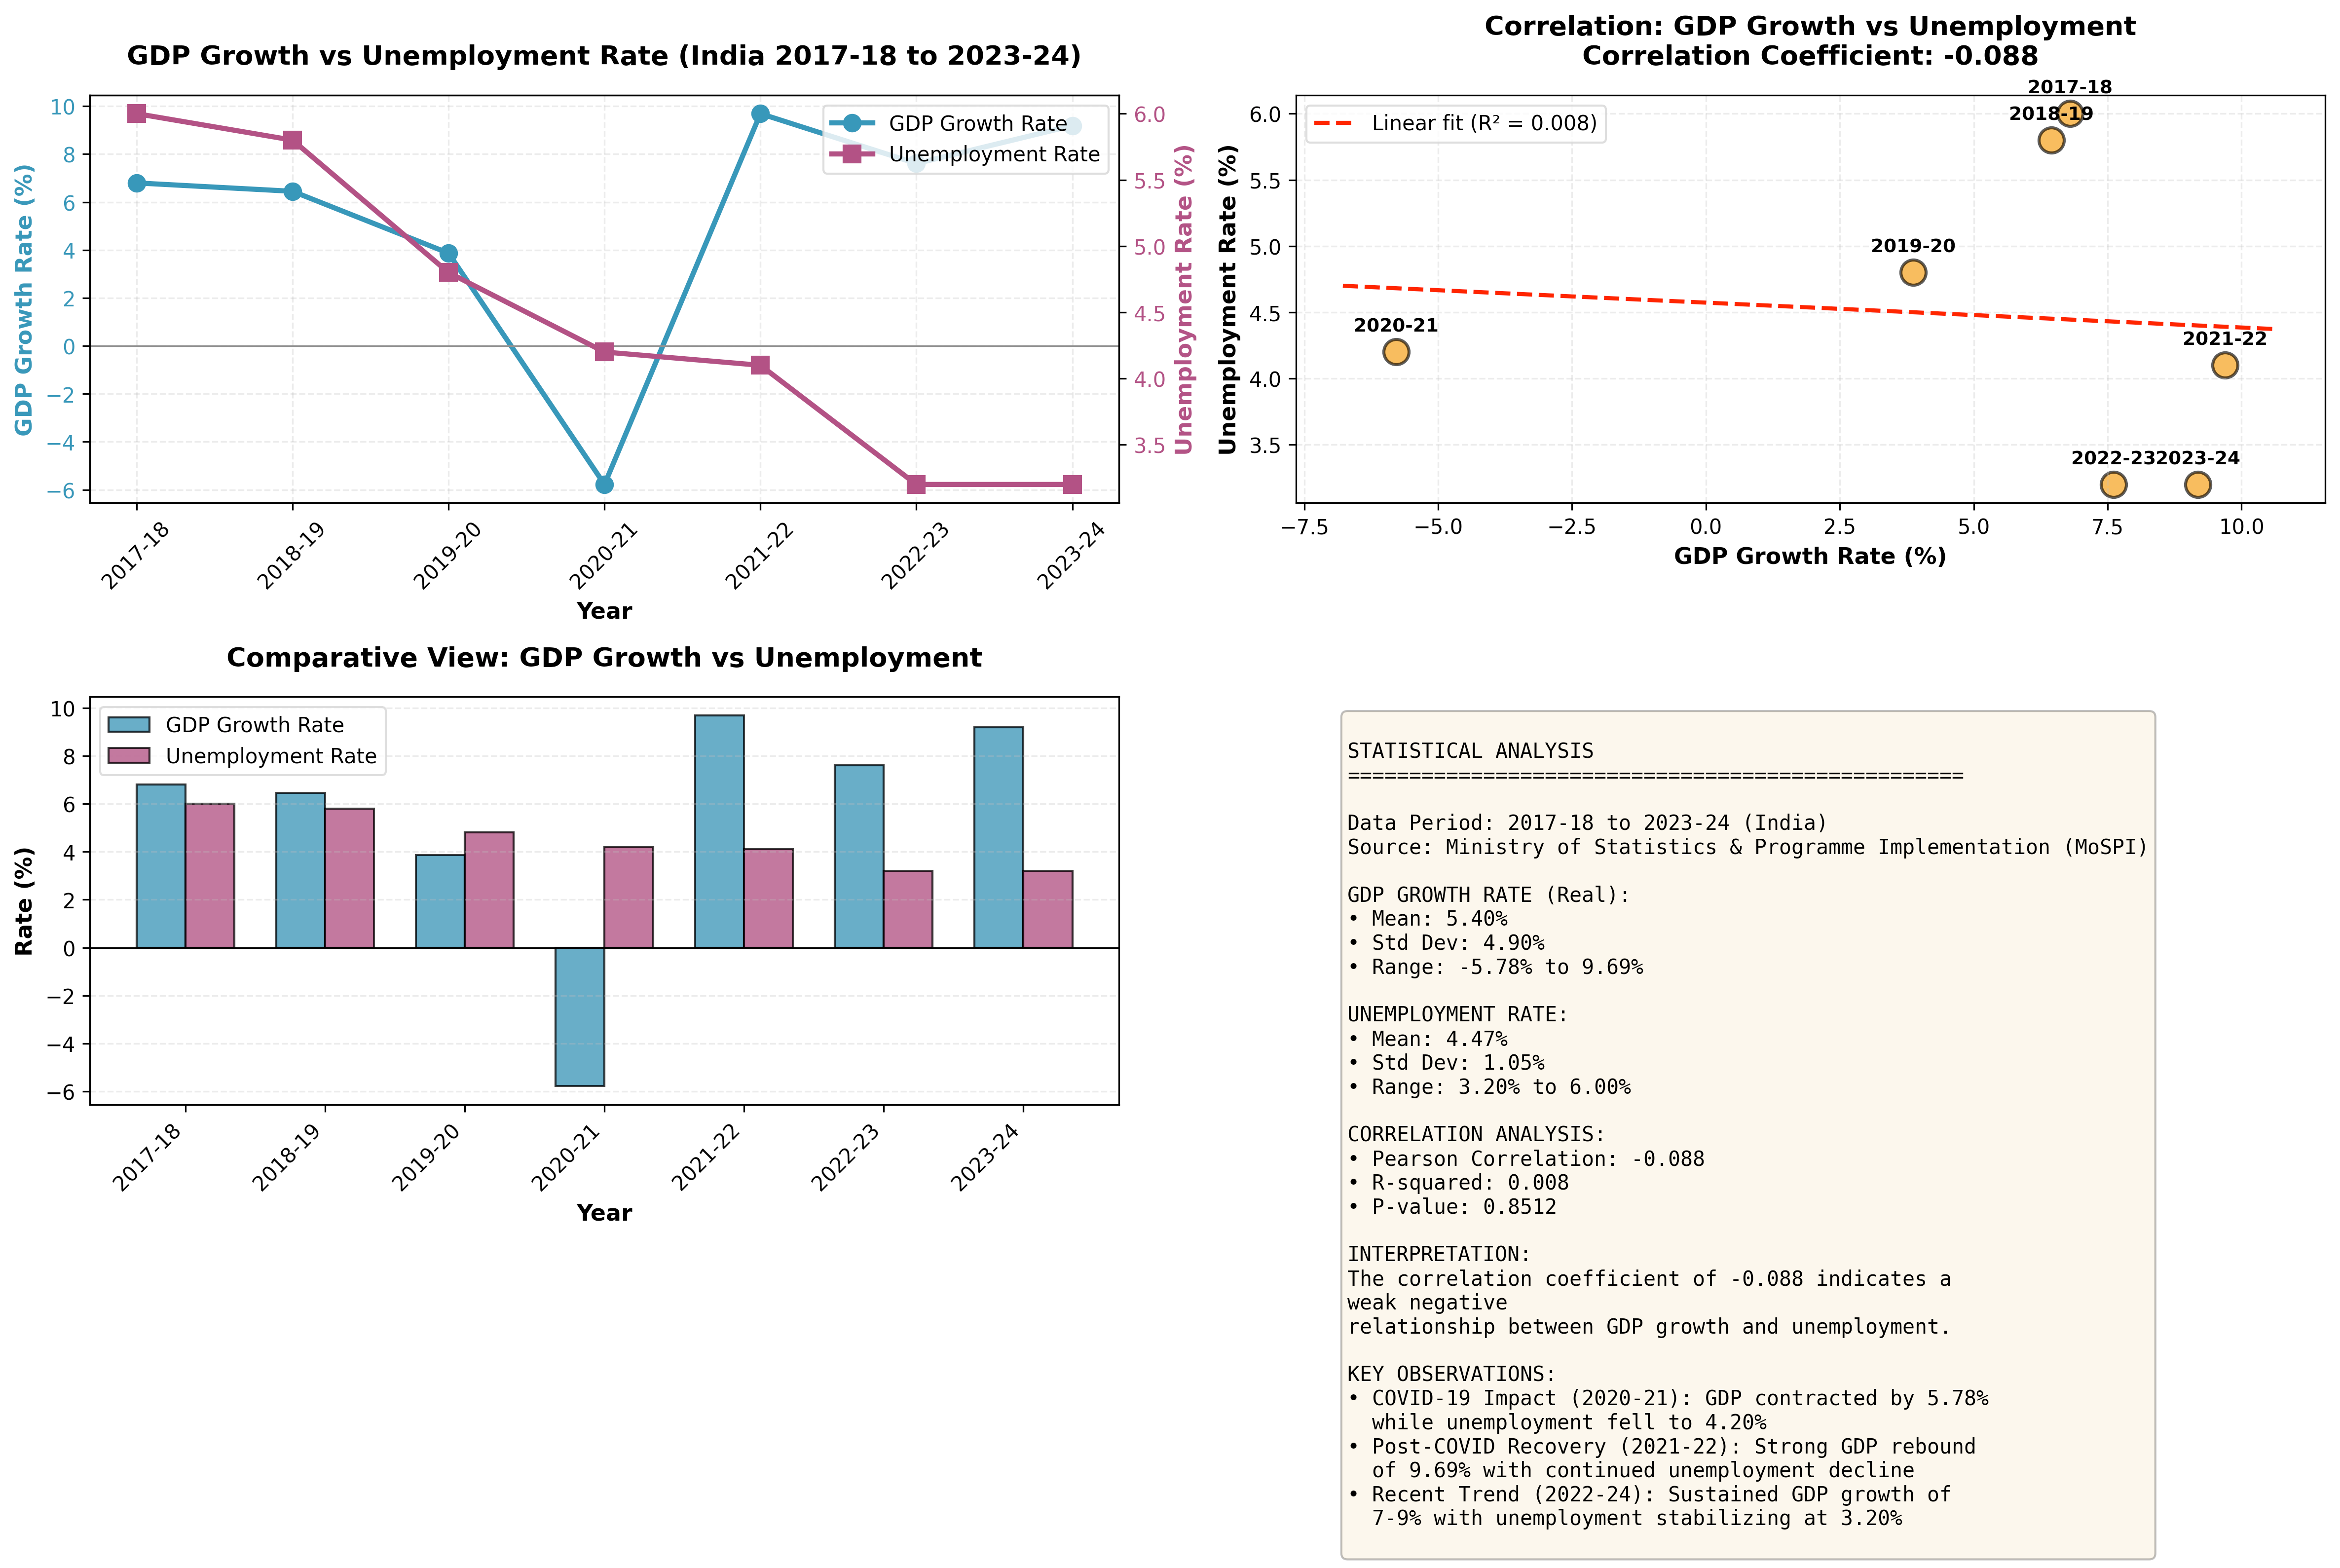
alongside unemployment trends, with a bunch of stuff I didn't really ask for
A snippet from the chat:
1. Pre-COVID (2017-19): GDP grew at 6-7% while unemployment gradually declined from 6% to 4.8%
2. COVID Impact (2020-21): GDP contracted sharply by 5.78%, yet unemployment actually _declined_ to 4.2% - an unusual pattern that may reflect:
    - Rural employment programs
    - Workers exiting the labor force (not counted as unemployed)
    - Measurement challenges during lockdowns
3. Recovery Phase (2021-24): Strong GDP recovery (7-10% growth) coincided with continued unemployment decline, stabilizing at 3.2%
Data aggregation is okay, but I don’t like this very much because now it is using these numbers to make judgments to find a pattern. Whether correct or not, suggestions like “may reflect rural employment programs” or “measurement challenges during lockdowns” are not based on reasoning because Claude does not “reason” or understand this data in any larger sense.
Claude as a librarian is okay, Claude as a economist is not. For a casual user, these bullet points carry the same “official” weight as the raw numbers fetched from the MoSPI server. What is the part that MoSPI reported and what is the part that Claude thinks sounds plausible to say? It sounds correct, no? And indeed it might be, but because it is generated without access to the full context that humans have (such as the in-depth reports by Data For India), it risks being confidently wrong. Plus when you have charts to go with it, you might feel even more inclined to include these interpretations wherever you decide to use this information.
Surveys with different base years
When I shared an initial draft of this post with Vivek, he asked how this MCP handled different “editions” of the survey. For example, in the CPI dataset, the base year for comparison shifted from 2011-12 to 2023-24.
An expert group has been working on a new CPI series and revising the CPI base year from 2011-12 to 2023-24, as the household consumption patterns have evolved from 2011-12 and do not reflect current behaviour.
Suppose a researcher requests a time series but has no idea that a base year revision has occurred. Can the tool inform this casual user about the caveats? If I don’t know the history of the CPI dataset, and perform an analysis using an older base year that has a significant lag compared to the new series, my conclusions could be flawed. Ideally, the benefit of having an ‘agent’ should be that I am informed of this discontinuity if it occurs in the data.
Right now, the MCP does not quite do that. Instead of offering a warning, it lists outdated information. This is probably because the internal API itself is lagging.
Based on the MoSPI CPI dataset, there are **two base years** available for comparison:

1. Base Year 2010 - older series
    - Data available: 2011-2014
    - Only "Current" series available
2. Base Year 2012 - more recent series
    - Data available: 2011-2025
- Both "Current" and "Back" series availableThoughts
I may not fully grasp the extent of what is possible here, perhaps due to my own limitations with these specific surveys, but the primary value I see is in accessing and filtering data. This tool isn’t for generating full reports or creating complex analyses from scratch but becomes useful when you have a specific target like doing a quick ‘gut check’ on a number or assembling a small dataset (like the CSV examples I created) to analyze elsewhere. And it is obviously more useful because it is unopinionated. If I want to correlate rural inflation with a completely different indicator, whether valid or not, I can. A dashboard doesn’t allow that, a PDF definitely wouldn’t allow that. But you should be aware to some extent about the dataset you’re looking at. Going in blind may, like the last example demonstrated, lead you into the wrong analysis.
There are more possibilities too. You could create pipelines that take this data and automatically create Datawrapper charts, with the Datawrapper MCP. Or create and send email reports if some number somewhere changes and other fancy stuff like that, but the core value remains data access.
Whenever there is a conversation about bring data people more easily, I think of the R package tidycensus, which wraps around the US Census API. It is an absolutely wonderful tool that has extensive functions and great documentation. To give you an example of how convenient the usage looks like, here is a snippet from the docs which shows how to plot median household income by Census tract in Manhattan.
Don’t worry if you don’t know how to read R code, the point is just how straightforward it is to go from API to visualization in a few lines:
library(tidycensus)library(tidyverse)options(tigris_use_cache = TRUE)# Fetch median household income data for Manhattan census tracts# B19013_001 is the ACS variable code for median household incomeny <- get_acs(geography = "tract", variables = "B19013_001", state = "NY", county = "New York", year = 2020, geometry = TRUE) # Include geographic boundaries for mapping# Plot the data as a choropleth map with a color scaleggplot(ny, aes(fill = estimate)) + geom_sf() + theme_void() + scale_fill_viridis_c(labels = scales::dollar)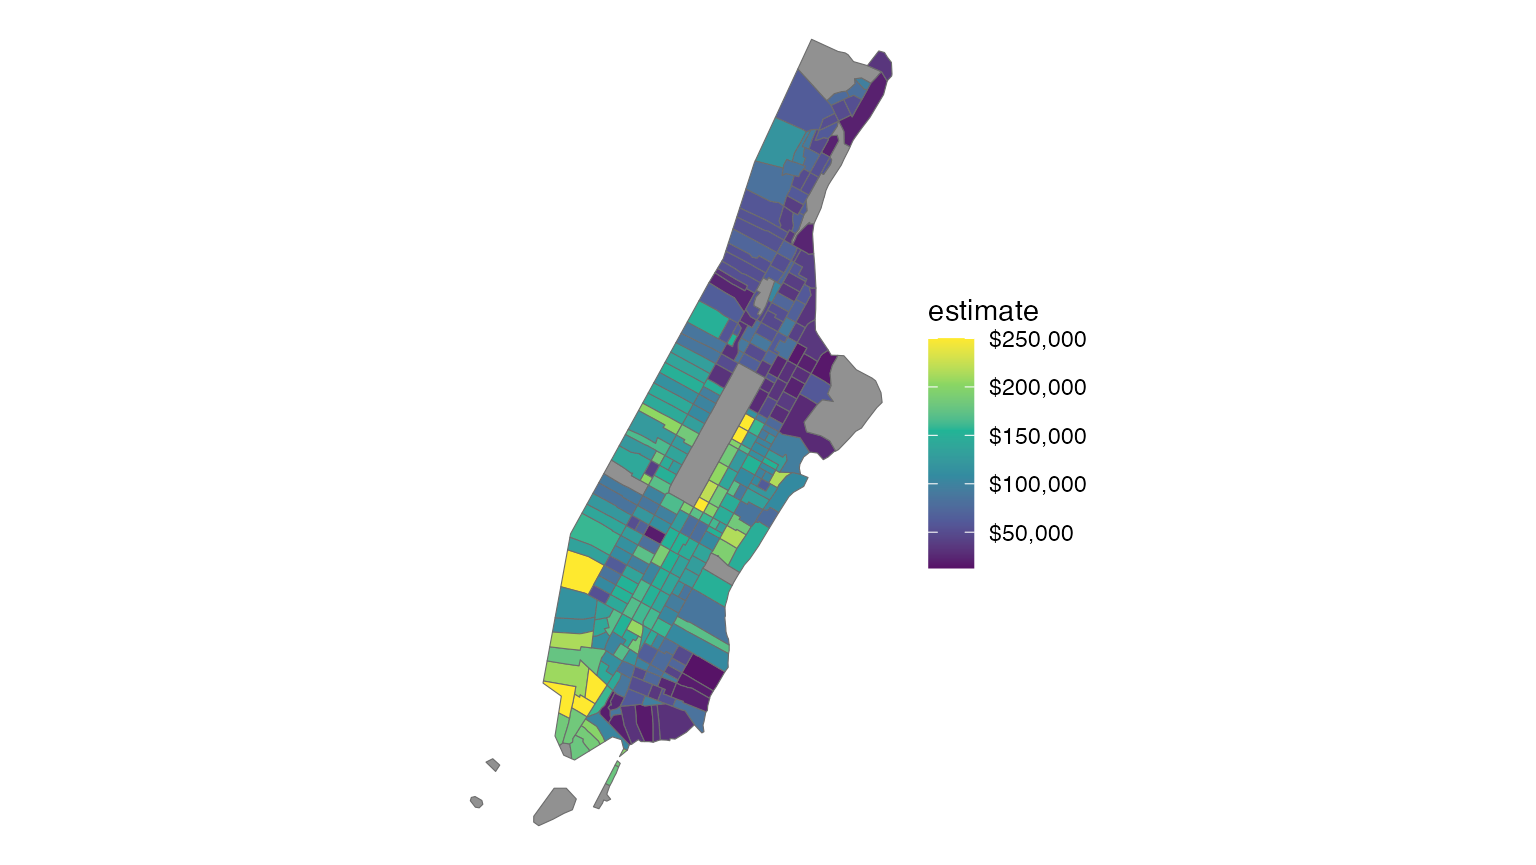
Great, isn’t it? Of course, this was made specifically for the census and didn’t try to unify multiple different datasets like MoSPI has attempted.
If tidycensus lowered the barrier for programmers by allowing them to pull data using clear, deterministic code, then this tool lowers that same barrier for everyone else by abstracting away the API endpoints and parameter codes via natural language. However, unlike tidycensus which makes it very clear what is available, using an LLM feels to me a bit like rubbing a lamp and hoping a genie appears. You have to experiment to find the boundaries and the scope isn’t immediately clear.
The underlying MoSPI API is, in that aspect, more useful. Wholesale Price Index API page is here. This is what we need. Not dashboards but an API like this. No silly authentication and login and all that but something useable. GREAT! DO MORE.
curl -X 'GET' \ 'https://api.mospi.gov.in/api/wpi/getWpiRecords?year=2023&limit=1000&Format=JSON' \ -H 'accept: */*'At the moment, the MCP does not seem to be able to bridge the gap between taking our natural-language query and successful data retrieval to converting this to a raw API call. It would be amazing if, when the chat session is done, I can ask it to write code to make the same API requests with R or Python and do the same operations. That should be possible to implement if the LLM was also given some knowledge about the API structure. For example, if I finished chatting about the WPI dataset and just want it to summarise that into an R script, it being able to generate those API calls and write some boilerplate seems useful to me, even if it isn’t as tidy as tidycensus.
library(httr)library(jsonlite)# WPI for textile manufacturing, Aug 2023 vs Aug 2024res <- GET( "https://api.mospi.gov.in/api/wpi/getWpiRecords", query = list( year = "2023,2024", month = "8", group_code = "13" # Manufacture of Textiles ))df <- fromJSON(content(res, "text", encoding = "UTF-8"))$data %>%select(year, month, index)I will always prefer code over chat for this because it is reproducible. One goal of this tool should be to teach you how to not need it anymore, and code is a way to do that.
Like I said before, this new MCP is definitely a welcome, good experiment and I am interested in seeing what else this team does. If they got around to implementing this for not just the macrostatistics but the raw microdata, it will be an even bigger leap forward.


