
Two Years of Word Games
December 27, 2025
Two years ago, towards the end of December 2023, Rhea and I decided that it isn't enough to just insult the other person for losing the Wordle or Connections on that day. Of course, it made for countless entertaining jabs, but 2024 needed to be the year of data-driven derogations.
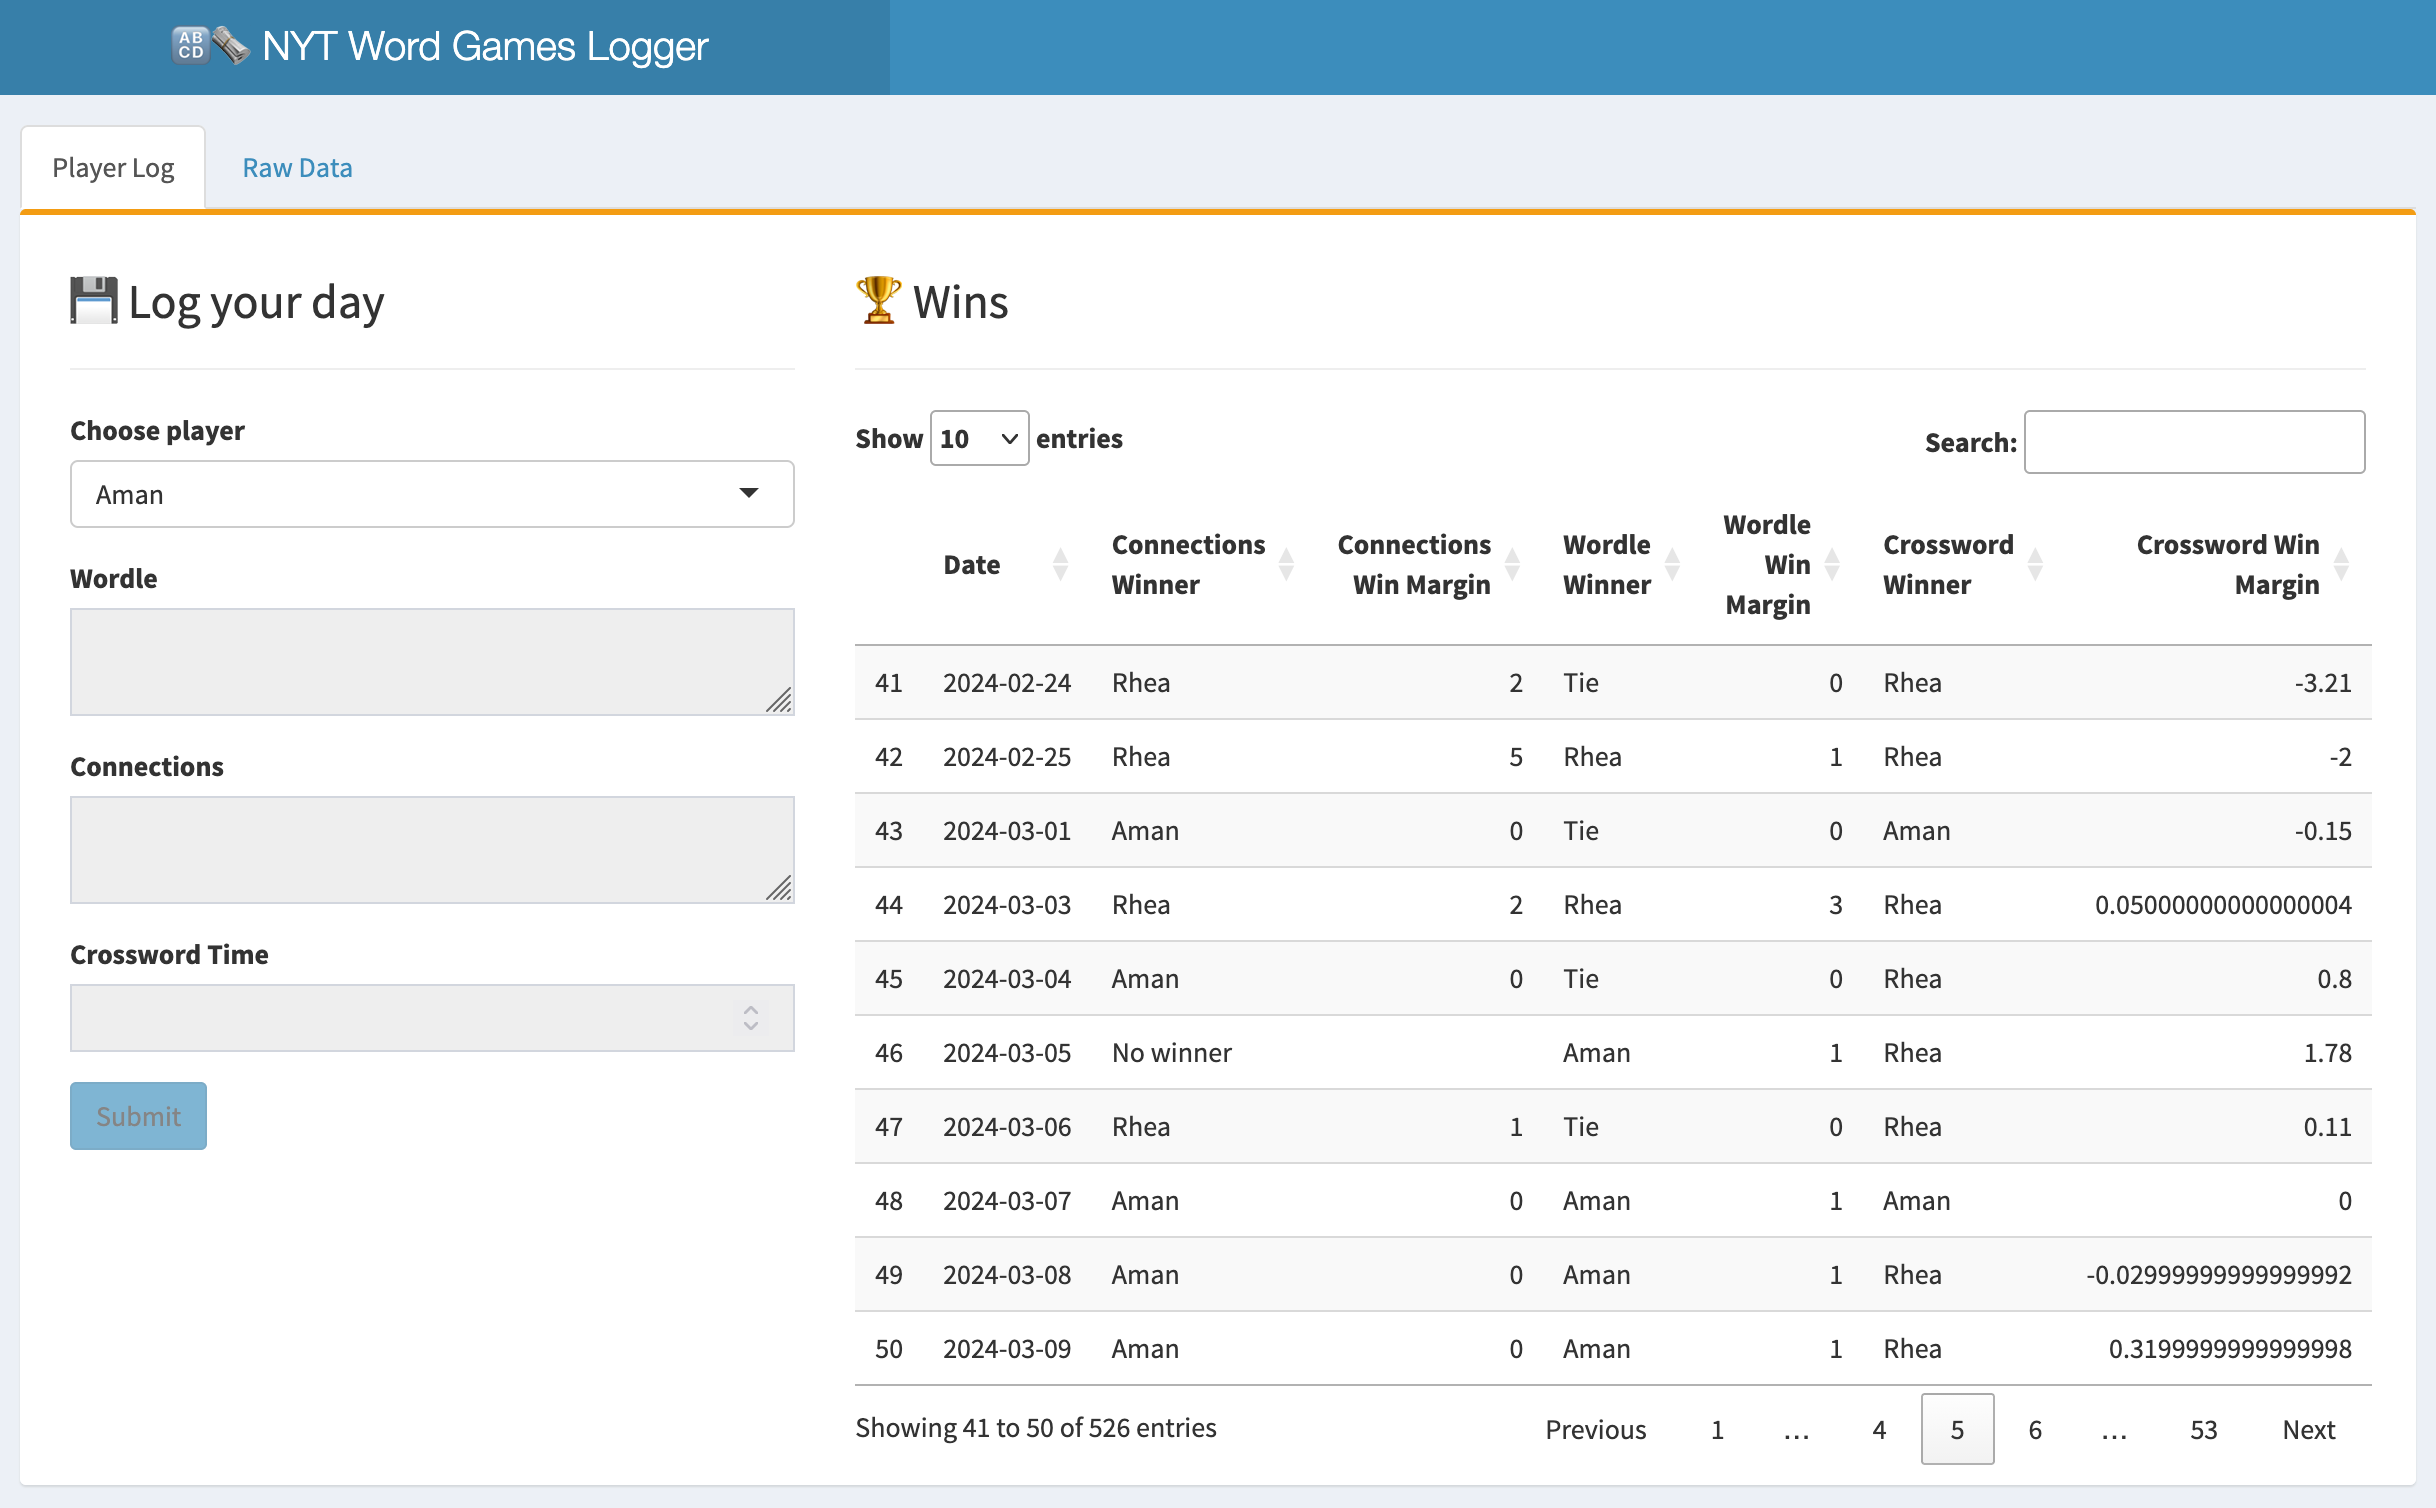
We wanted to find out who wins Wordle with the fewest moves, who wins the crossword the fastest, and who loses the most at Connections. I created a private dashboard using Shiny that is linked to a Google Sheet. It shows some basic statistics and figures out who won that day by looking at how many moves were made in Connections and Wordle, whether there was a winner, and the difference in times when each crossword was finished. By the end of the year, we wanted to have an answer to who the Loser Maximus was.
Well, it was me.
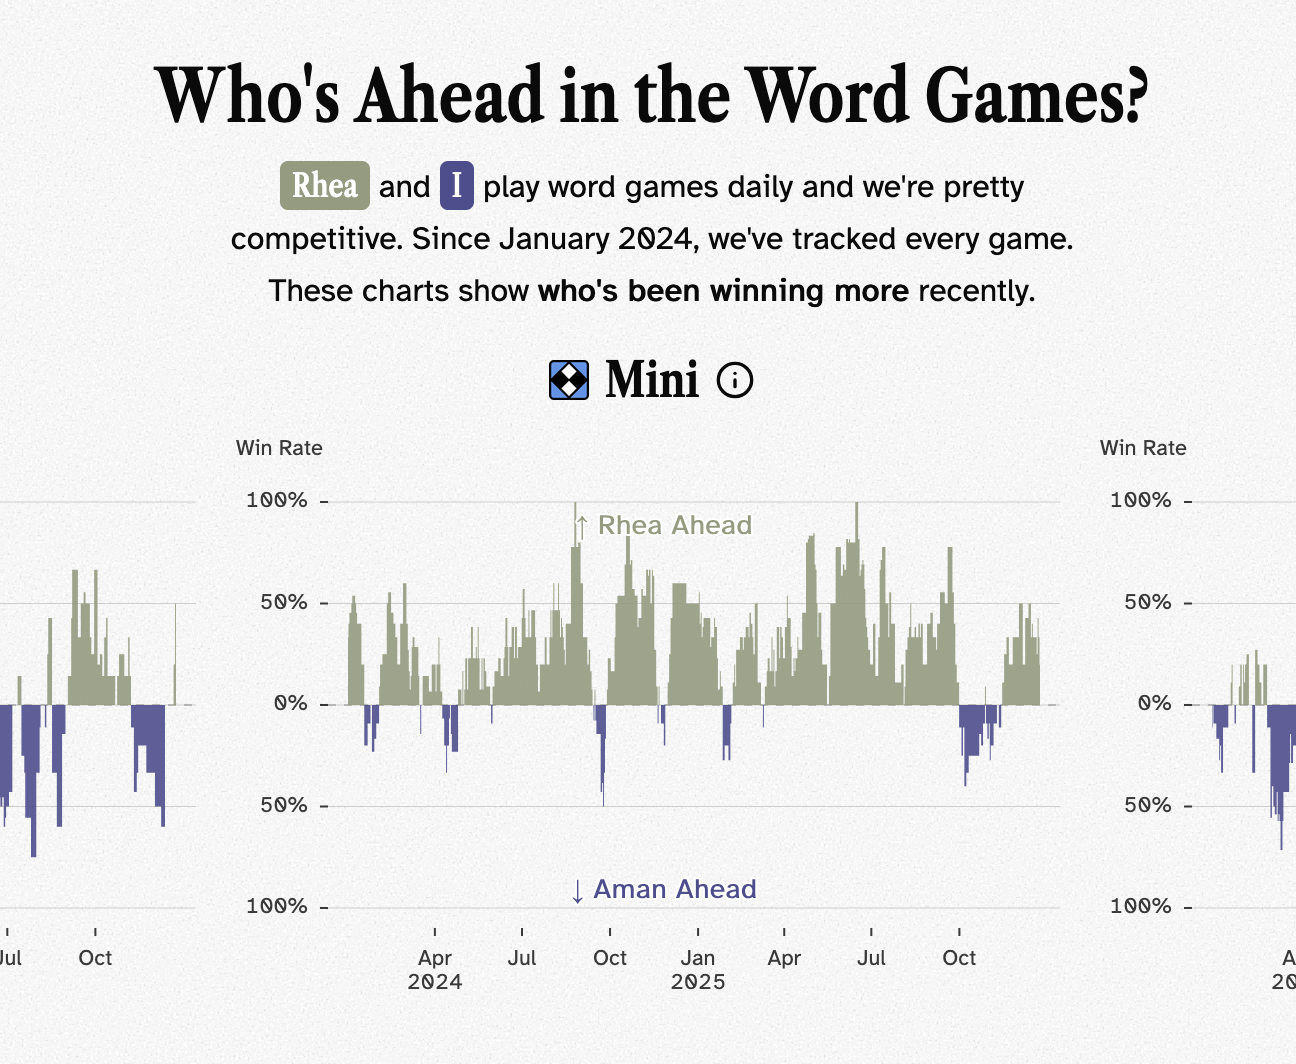
For the last year, I’ve had the win-percentage moving average trend on my homepage. Apart from the short period of deceit where I was, uh, conducting external literature reviews for additional information on the day’s Connections (not to cheat, of course), I’ve not had much luck beating Rhea. If you’ve visited my site at all during this time, you might have anticipated my loss easily.
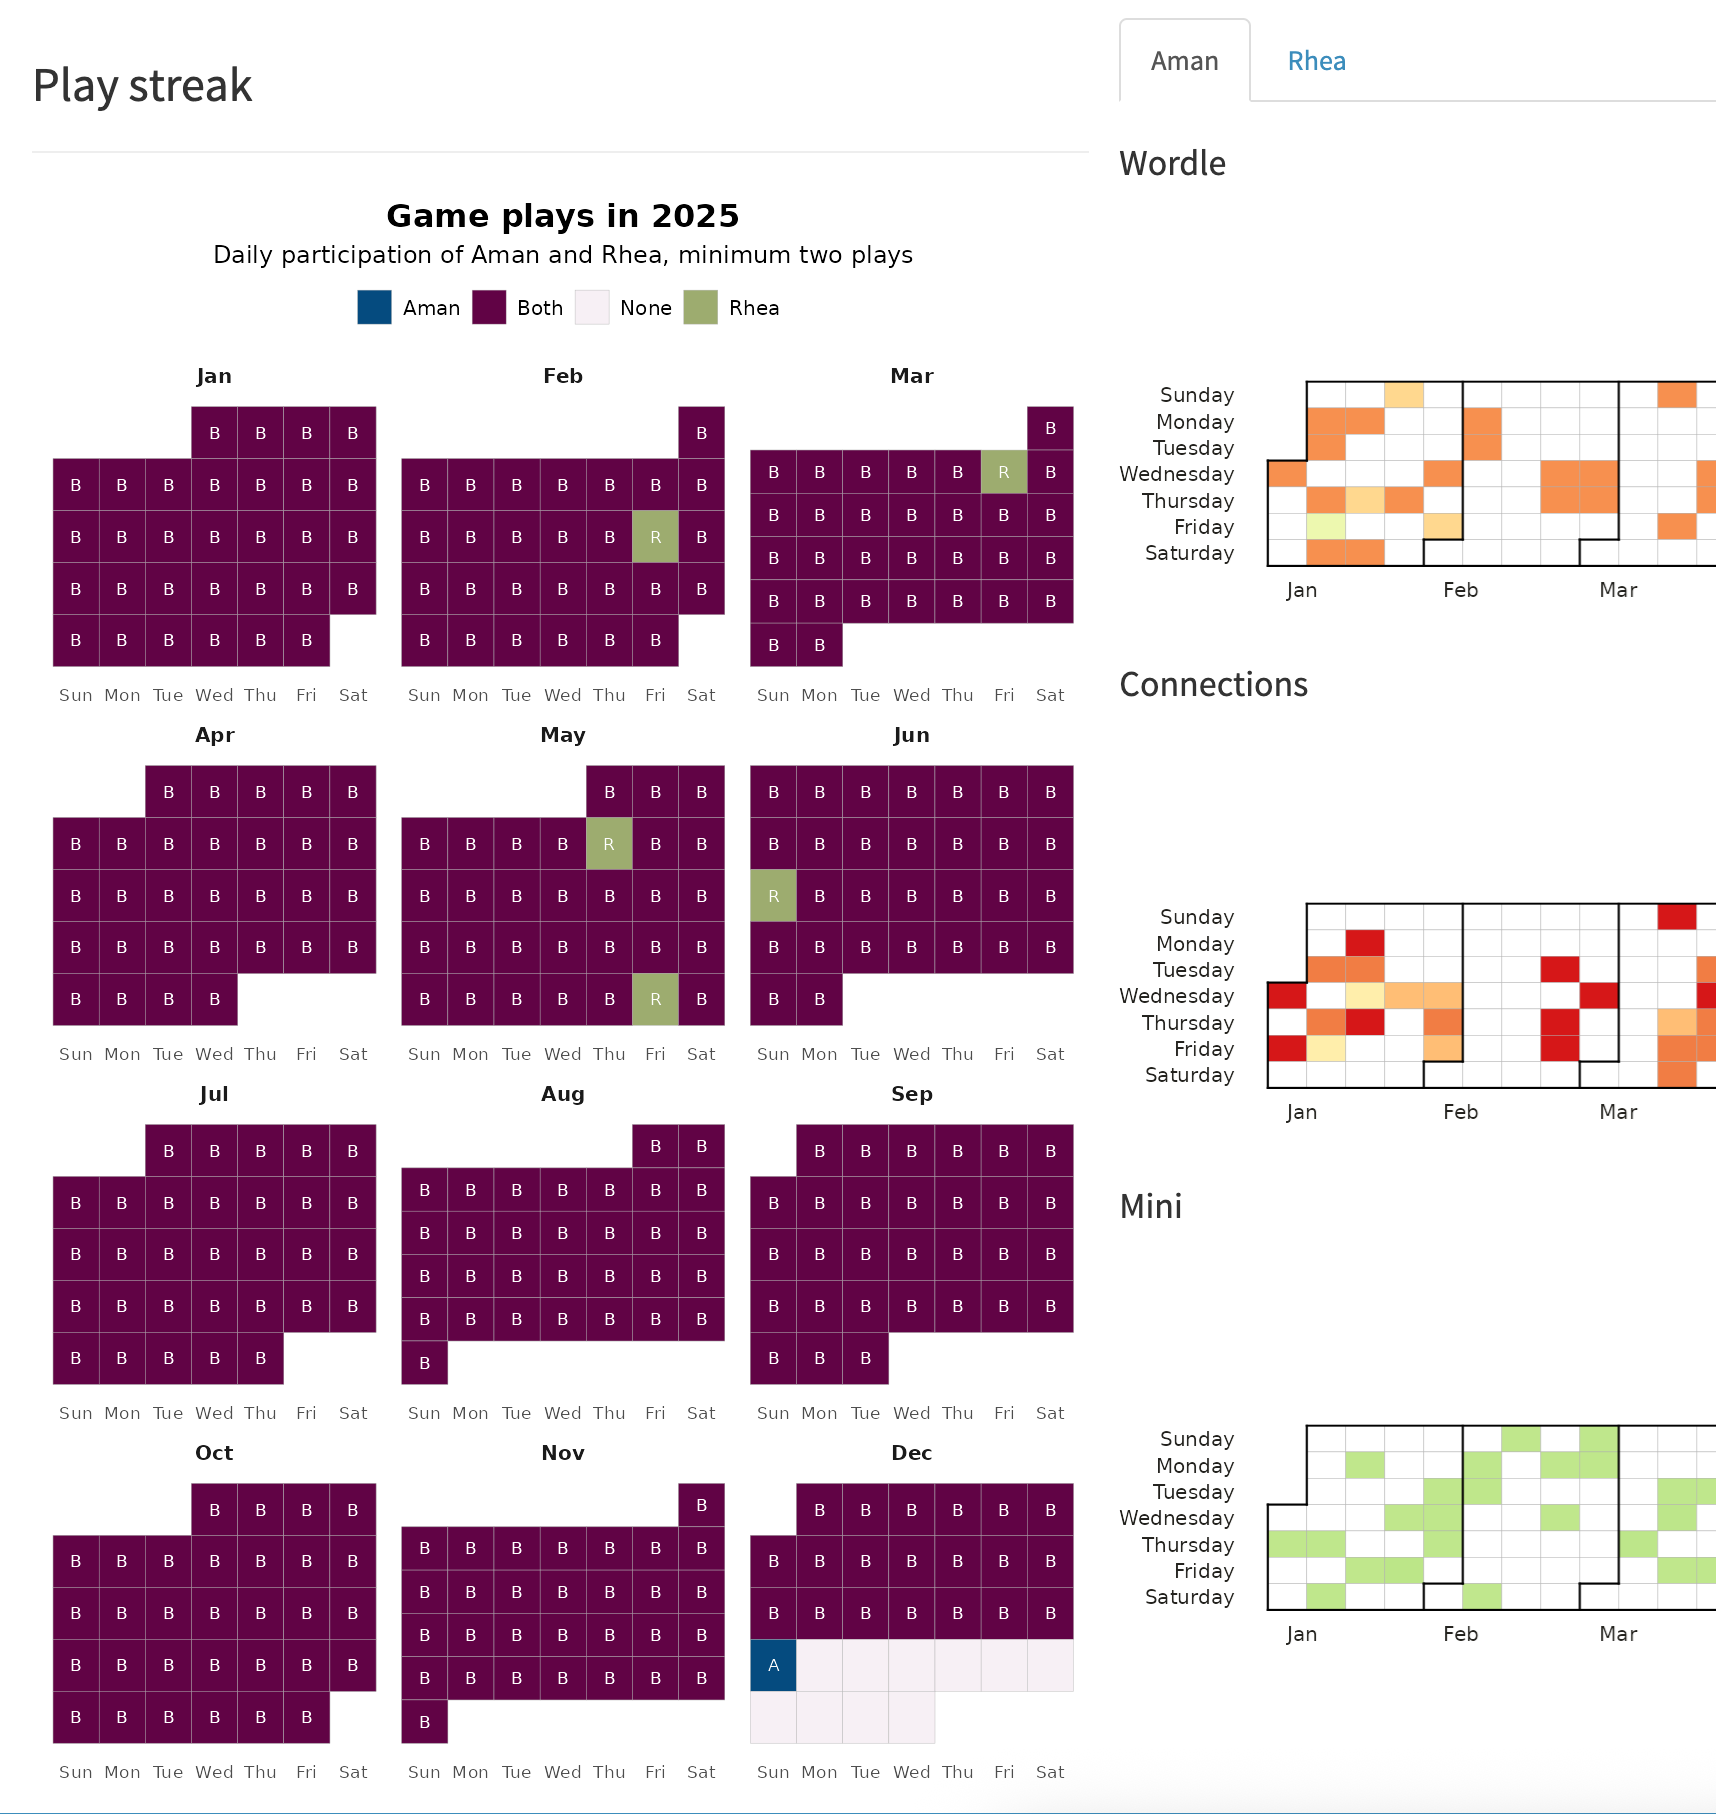
That is not all. Between the both of us, we place equal importance on just doing and submitting the game results on our dashboard for that day Note from Rhea: “I think it’s unfair to say we place equal importance. If we did, you would be submitting. And by looking at your 190-day streak it’s clear you do not. Seems fishy.” . This is what we count as our “Streak”. Winning is great, but at the minimum, it is about making sure that the calendar on our dashboard shows that we’ve submitted our play for that day. I wasn’t much good here either. In the past two years, Rhea has maintained a streak of 470-ish days of successfully submitting a game, only missing the one time on her birthday in 2024. In that period, she has travelled across timezones and settled into a new country. My longest streak is of 190-ish days. I’ve only had to manage my one timezone. So even by that measure, I have lost.
I have memories of several panicked nights as the clock drew to 11:56 PM and I had not done any of my games and resorted to kamikaze tactics to just LOSE GAMES FAST but have something to submit to the dashboard.
So yeah, whatever. Congratulations to her. It’s not that big a deal, okay. I lost on purpose.
All warfare is based on deception. Hence, when we are able to attack, we must seem unable; when using our forces, we must appear inactive.
I promised myself last year that I would do a year-end roundup, but I had so few data points that it was pointless to compare. However, since we are now in the second year of gathering this data, it is worth examining. Maybe even beyond the simple wins and losses (again, I lost deliberately, okay).

The below analysis is done in R and the charts are created with ggplot2. I experimented extensively to try and recreate the embroidered aesthetic that this Reuters Graphics piece has, and with Fred’s Imagick scripts and some long hours of Imagick tinkering, I could get pretty far. Every visual here is made programmatically.
Just know that each loss was an extremely calculated decision.
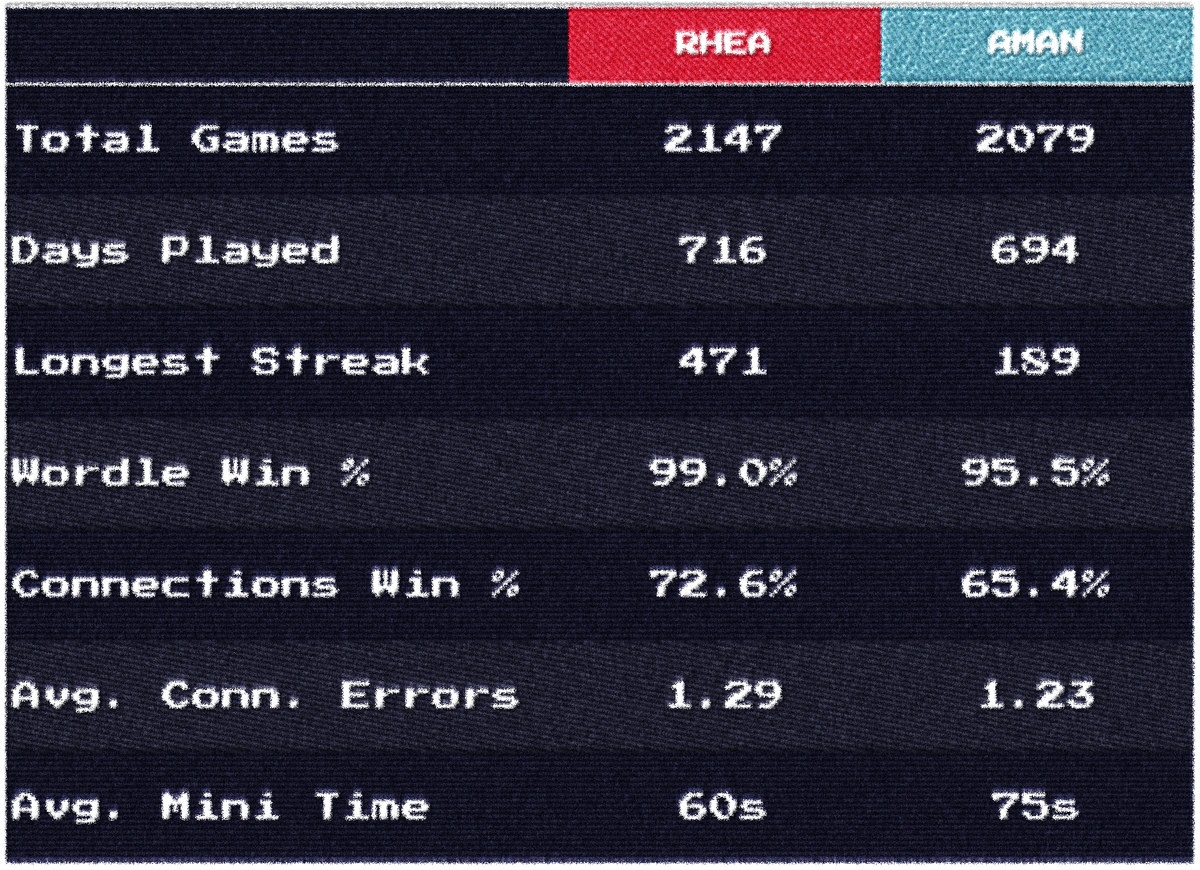
Let’s start with Wordle. Over the course of these two years, we’ve played approximately 700-something Wordles. I fall short by around 20 games because I missed submitting those days (when I felt like giving Rhea a better shot at winning). There isn’t much difference in the number of moves it takes for us to win, but Rhea has a higher overall win percentage.
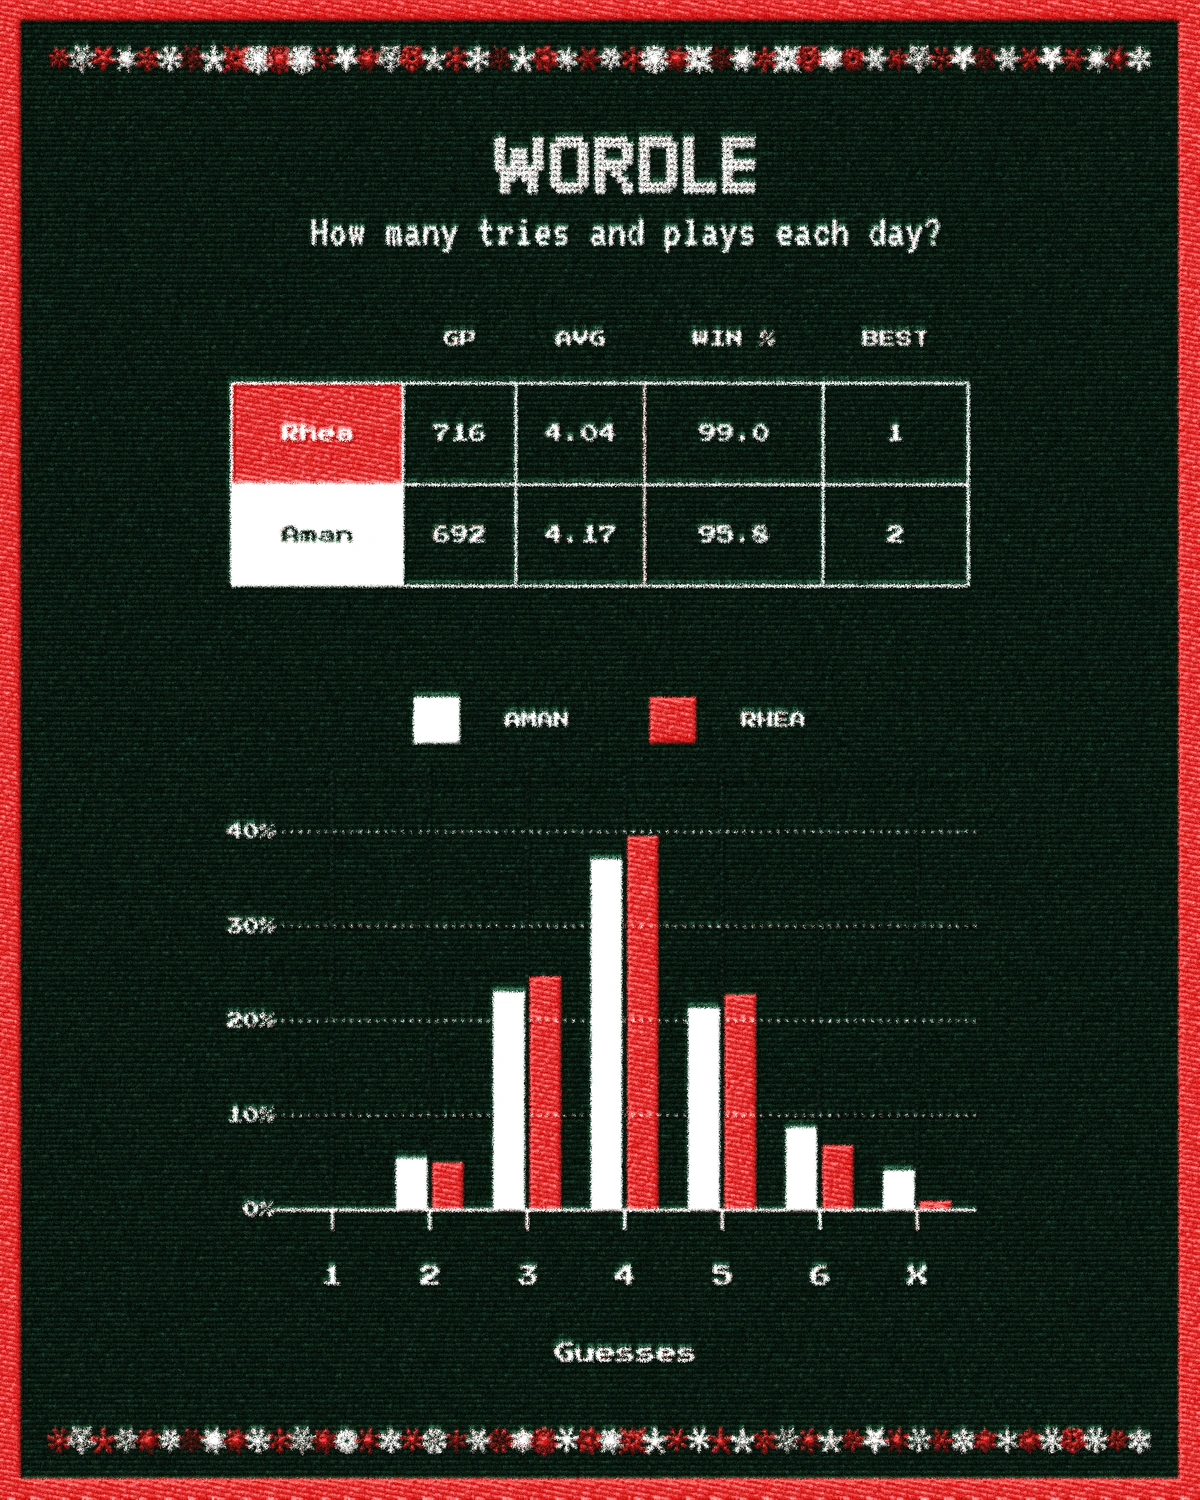
On December 19, 2025 the world broke down into utter chaos marking the 2025 Wordle Riots, where everyone except probably this person lost their minds as each vowel turned gray. The word of the day was MYRRH and the mobs, frankly incensed, overturned cars and set fire to dictionaries in a blind fury, unable to process the tragedy that befell their streaks. Based on WordleBot data for that day, the average solve happened in 4.04 guesses, which isn’t as bad as it could be? As for us, I am much better in an emyrrhgency than Rhea, who guessed the word in the average number of tries whereas with my 3 guesses to win, I fall in the group of only 17% players globally to solve it that way. (😎)
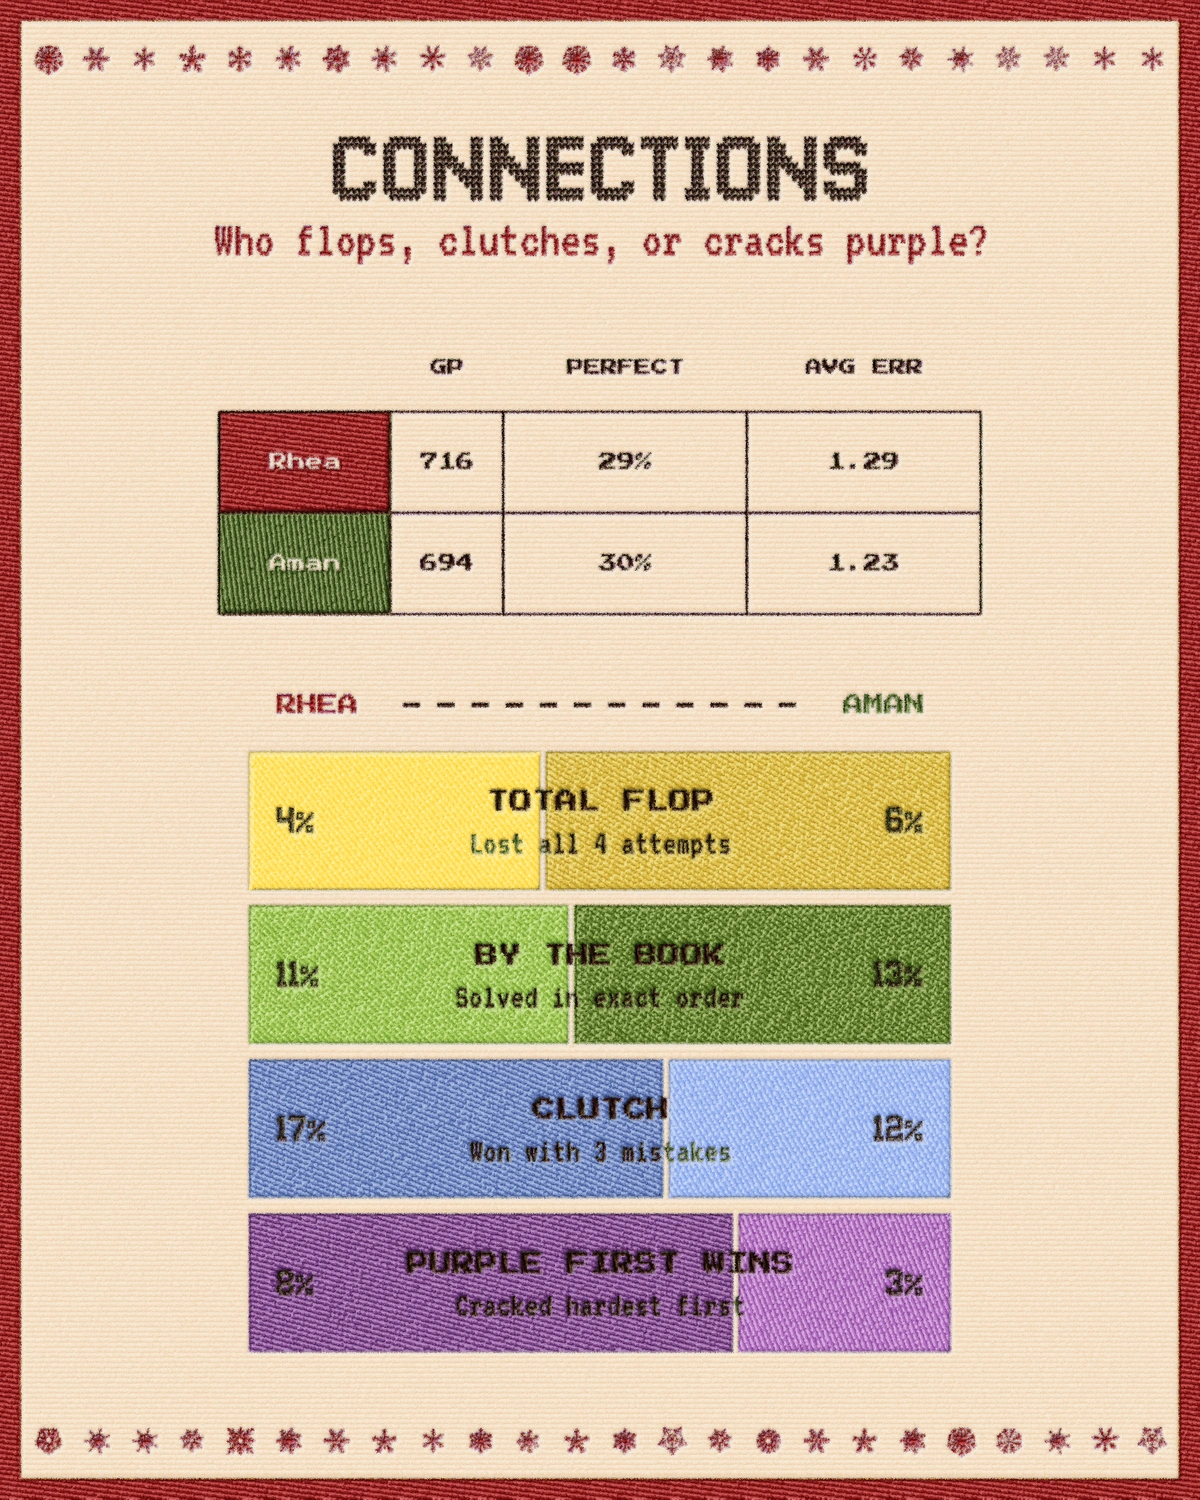
While Wordle Riots may be an annual occurrence, flinging your phone after Connections because of anger happens daily. In the groups of four that we are meant to find, I usually solve things BY THE BOOK, in their intended order, whereas Rhea finds PURPLE FIRST. I also manage to have TOTAL FLOPS a lot more, which makes logical sense. I usually try to solve the Wordle with sincerity, but absolutely bulldoze my way through the Connections because it makes my brain hurt. It appears that Rhea also makes mistakes and lives on the edge, often using all the mistakes she can avail in a game but still getting out a CLUTCH situation by winning.
NYT players, lest they feel left out of any shared anguish, were given a chance to riot when the powers that be decided that the masses should pay for The Mini. Of course, speaking for myself, I am happy to sacrifice the few minutes of joy I get out of playing it so that the shareholders can be happier and the KPIs point up. It is my duty and I have no cross words for the management.
Since that day, we’ve switched to using crosshare.org for our fix. While the NYT ramps up difficulty throughout the week, Crosshare is by indie constructors, where a Tuesday puzzle can be harder than a Saturday one. Despite this new lack of structure, I have not improved in my performance in 2025, and if anything, my time has increased. Rhea has maintained a steady performance and continues solving these with the annoying efficiency. Although she complains that Crosshare’s keyboard is a little janky, making her slower; I must look into seeing if I can contribute code to making it jankier.
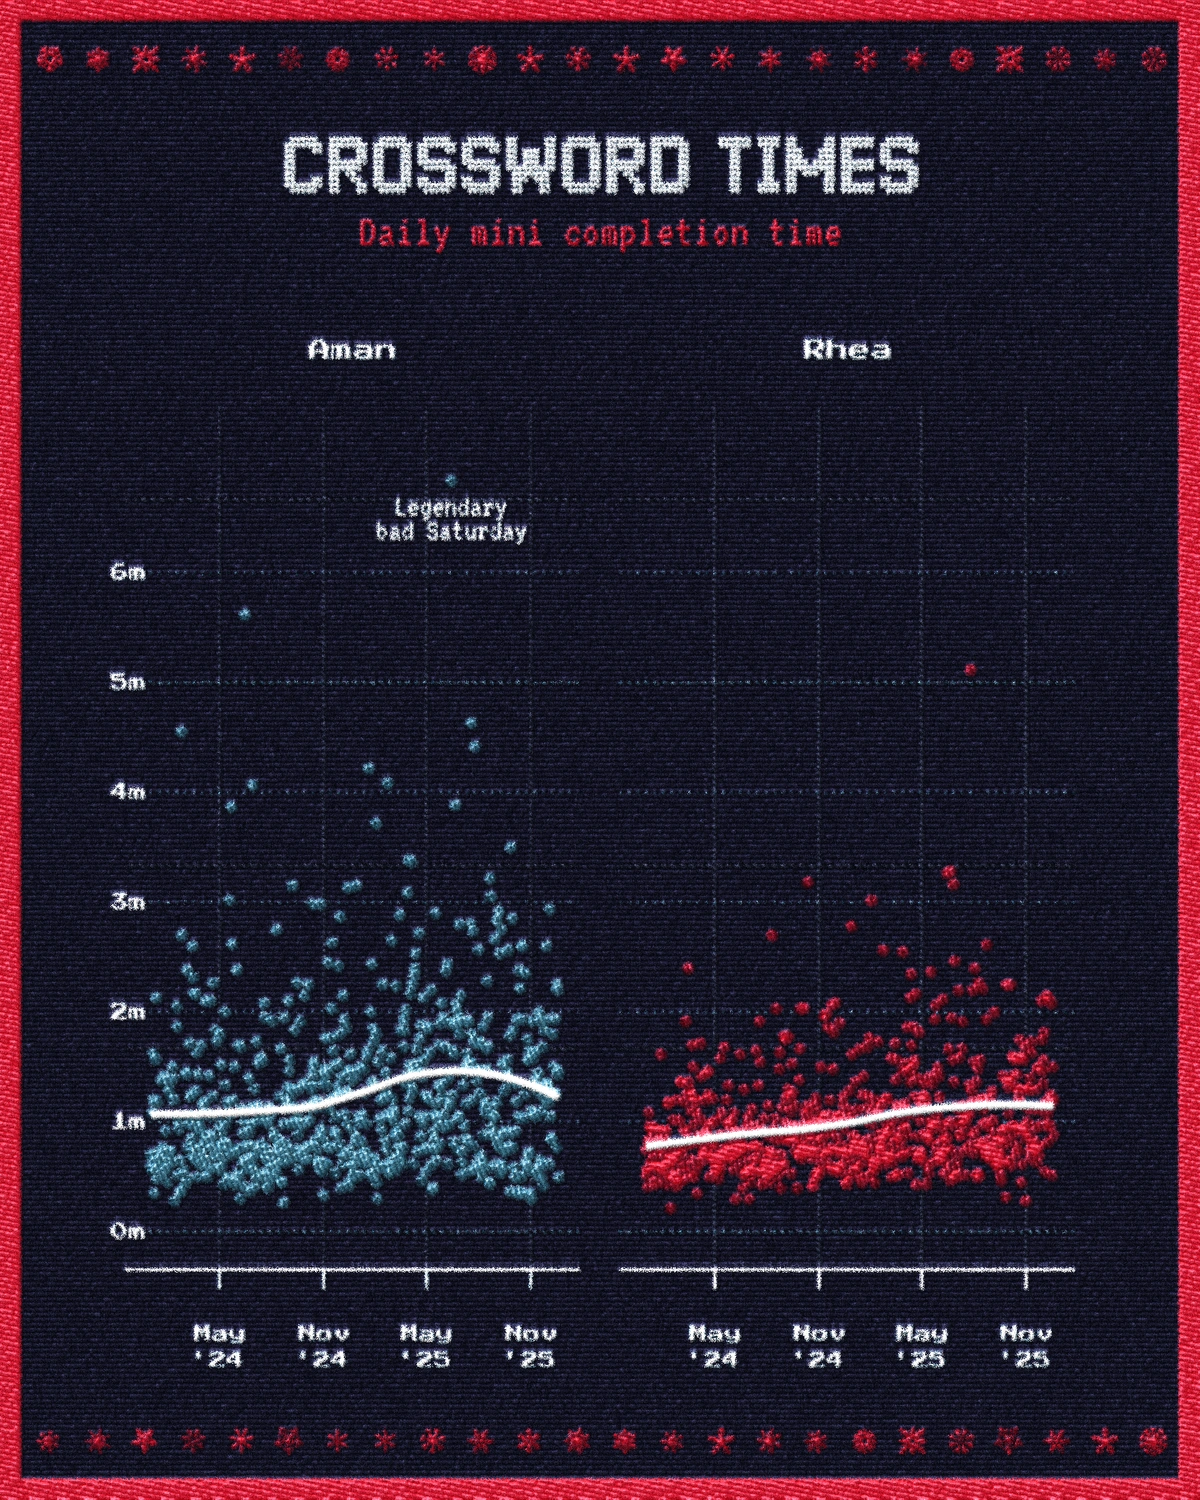
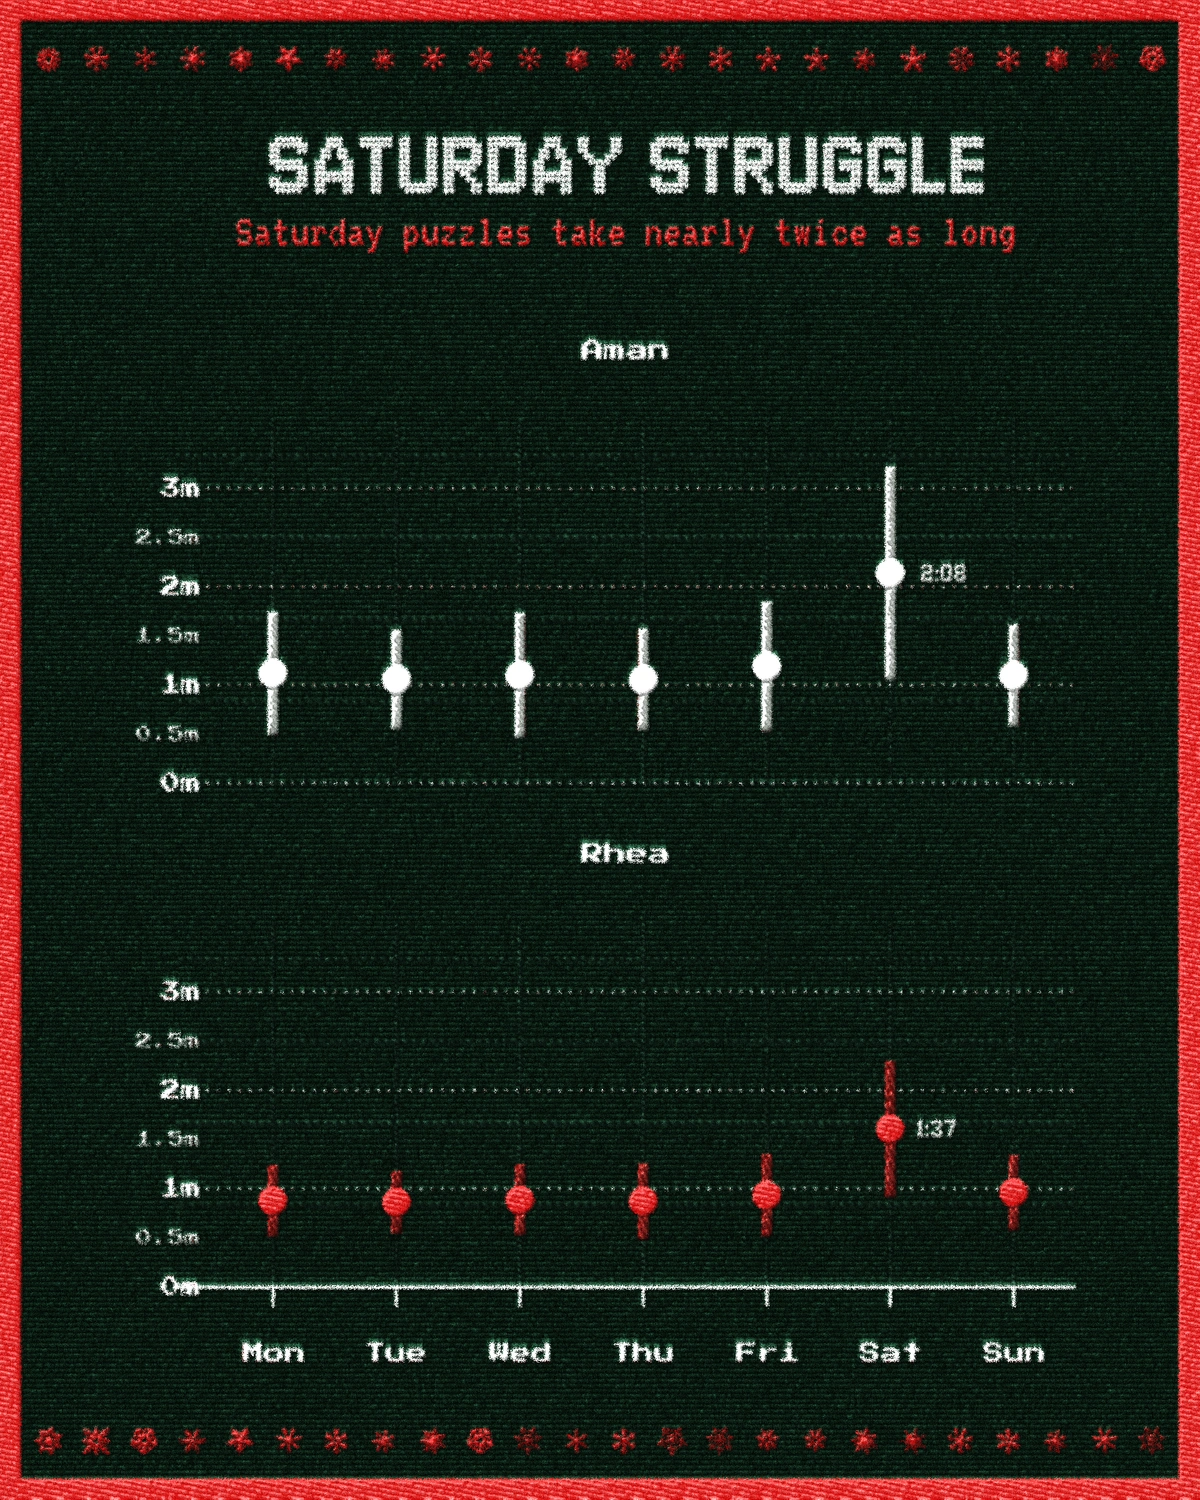
I firmly believe it depends on how you interpret the data. Rhea minimizes her time on the page to be efficient. I maximize my time to get the most value out of the experience. So if you look at the metric of “Total Time Spent Enjoying the Puzzle,” I am winning by a landslide. I tend to stop and smell the roses most on Saturdays, where my solve time nearly doubles from the average on any other day of the week. It increases for Rhea as well, but not quite as much, and overall she has a lower variation in time throughout the week.
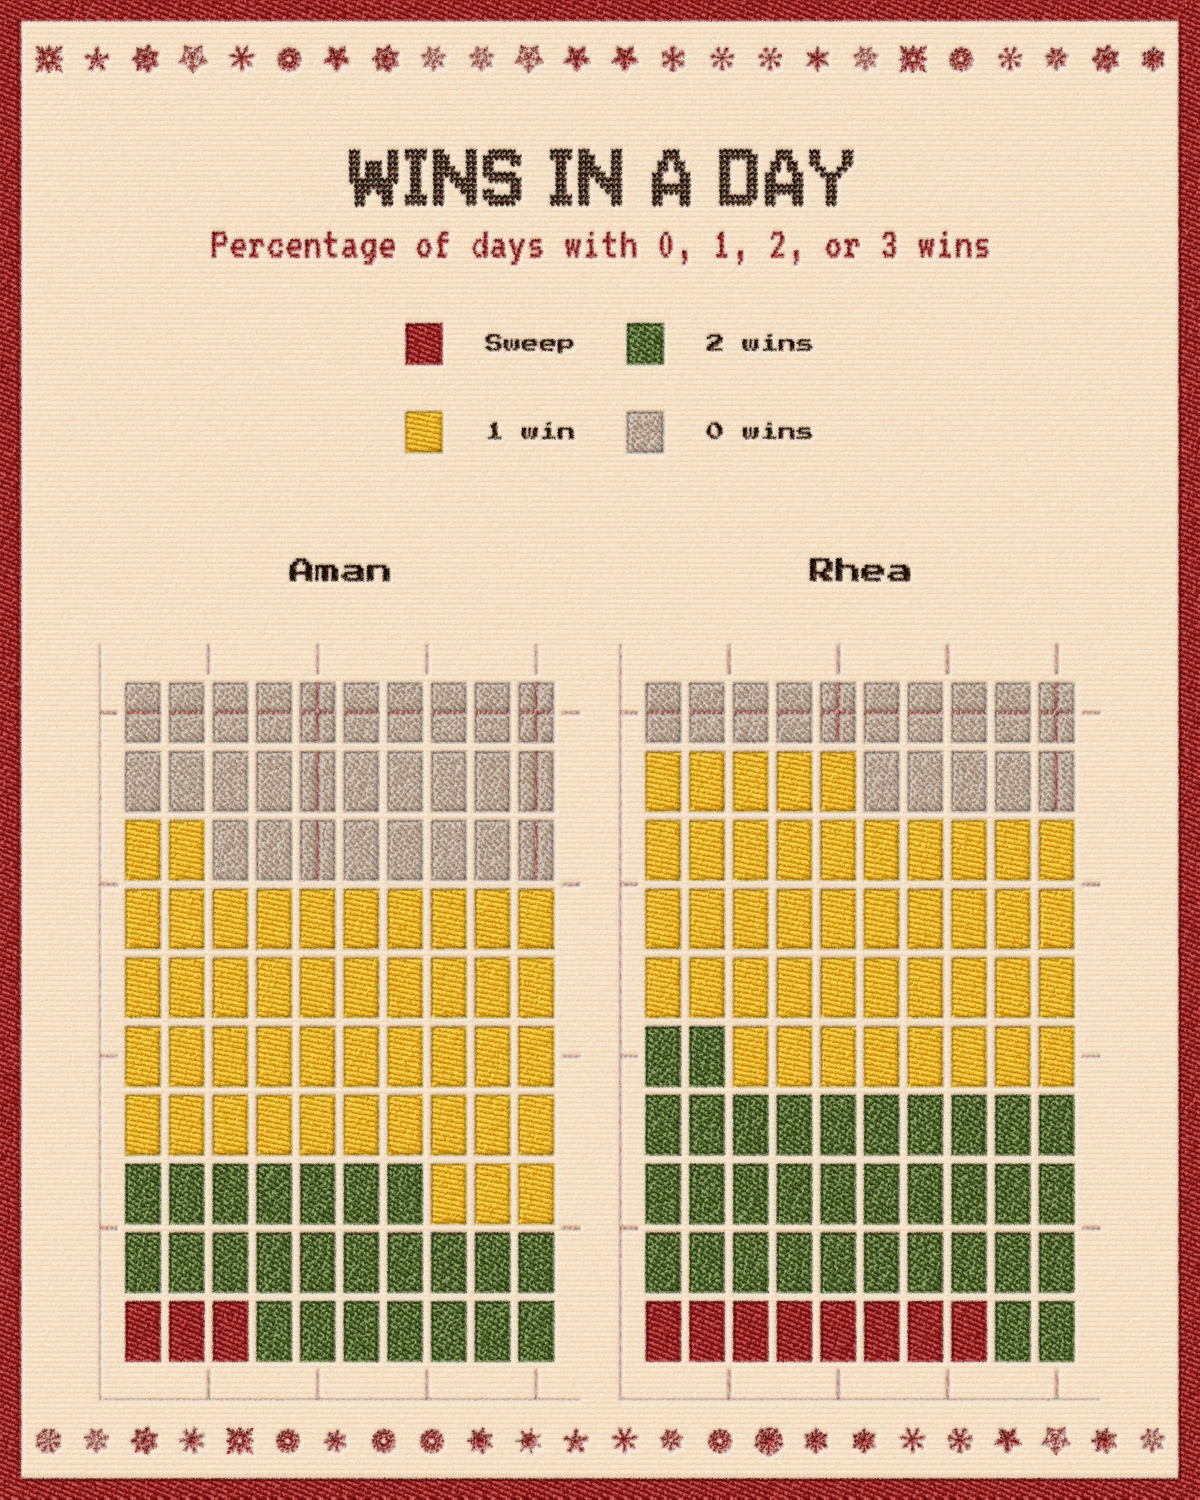
One thing is to “win” the game itself; solving the Wordle, Connections or Mini correctly. But far more important is the Sweep, or beating the other person in all three games on the same day. Rhea’s side of the chart is a more festive pattern of red (Sweeps) and green (2 wins). On my side, however, out of all the games we have played in two years, only 3% have been days when I achieved Sweeps.
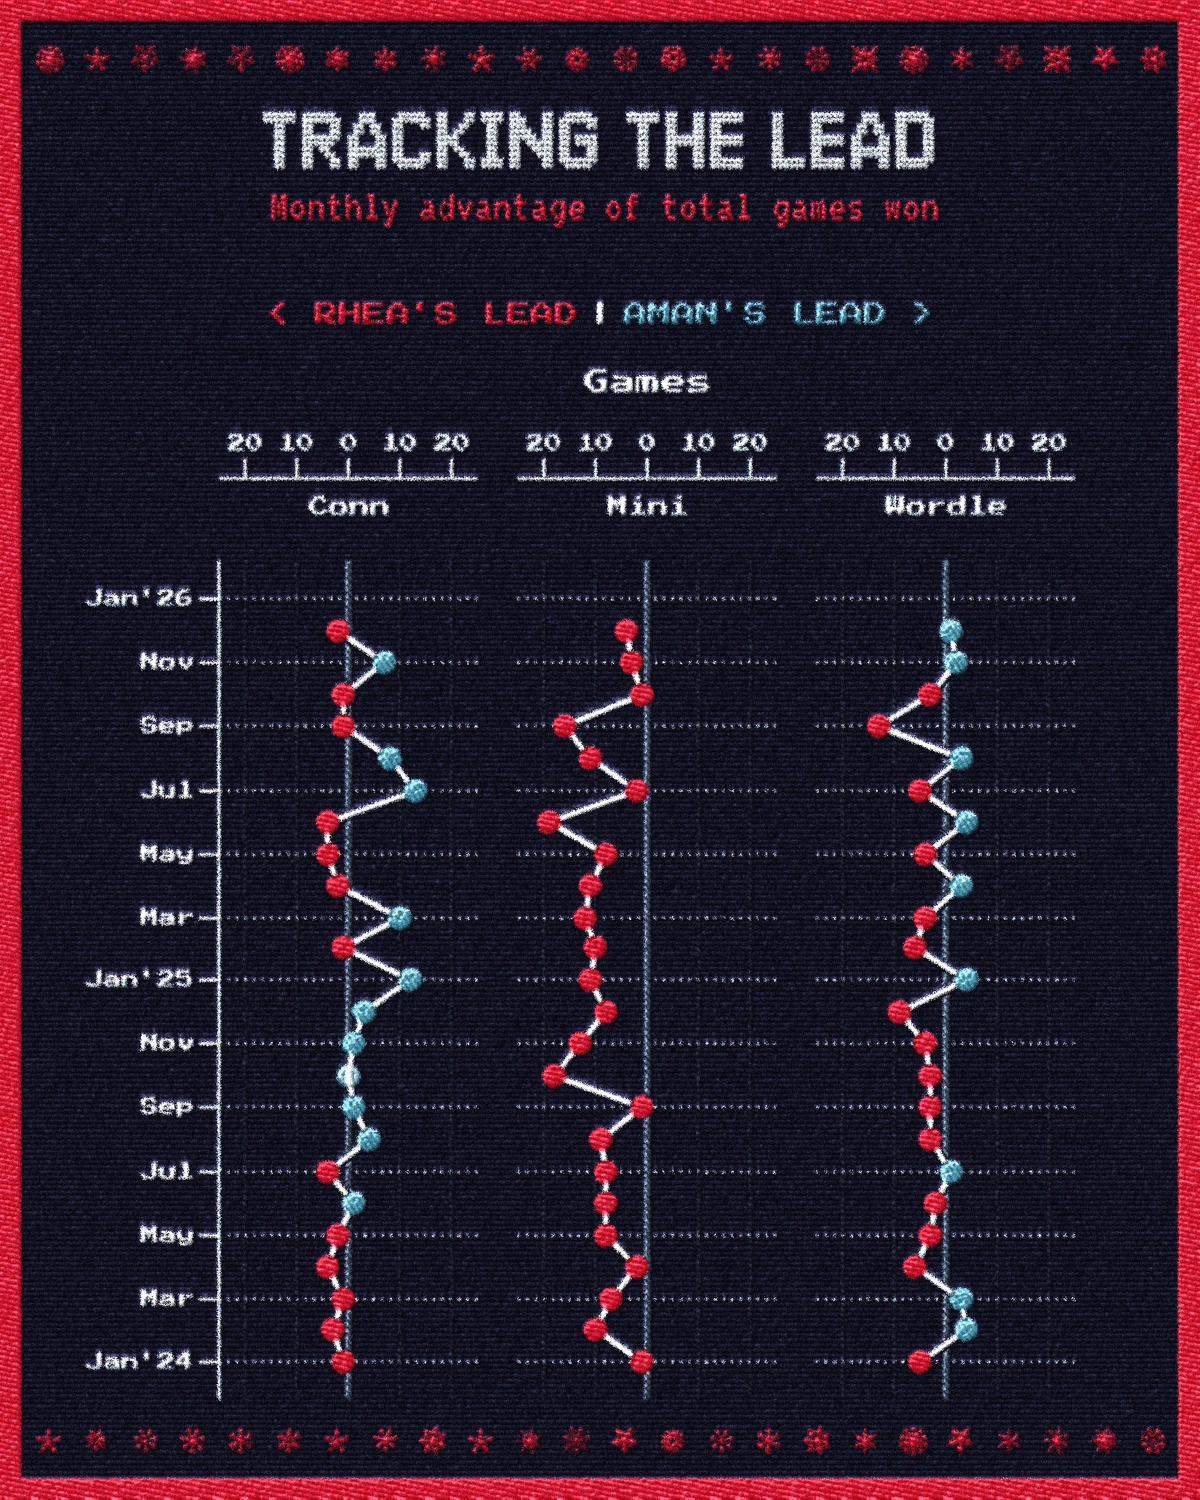
Finally, we zoom out to look at the aggregate momentum by looking at the total monthly leads in games won. Ignoring the Mini column is better if you’re rooting for the underdog. It is the only game where the lead never trades hands and the line hugs the left side of the axis (Rhea’s Lead). I haven’t had a hope in the two years since we started this. RIP. As we head into 2026, I am choosing to ignore that column entirely.
This was a short analysis of 700-something days of submitting data, with a total of 4,200 games played between the two of us. Submitting to the dashboard has become so routine now that I don’t think we’ll be stopping in 2026. I continue to hope for some timezone confusion to throw Rhea off from submitting her plays (and therefore breaking her 465-day streak); I have a strong feeling this is my year. I would also wish for winning the games, and while a sudden improvement in my performance is not impossible, you can admit it does seem statistically unlikely. Instead, I’ll settle for whatever victories I can manage.
If nothing else, losing has made me wiser and perhaps just more philosophical. Congratulations to Rhea. Don’t get used to it.
The notebook for this analysis can be found here, which also has the code used to generate the embroidered aesthetic (which you may or may not have hated). Our dashboard is a Shiny app which might be rewritten with Svelte in 2026, but meanwhile it can be found here (it is complicated for no reason, you can just hook up a Google Form to Sheets). Some of the code for this analysis was written with LLM-assistance. No written text was generated by LLMs because that would be rude.


