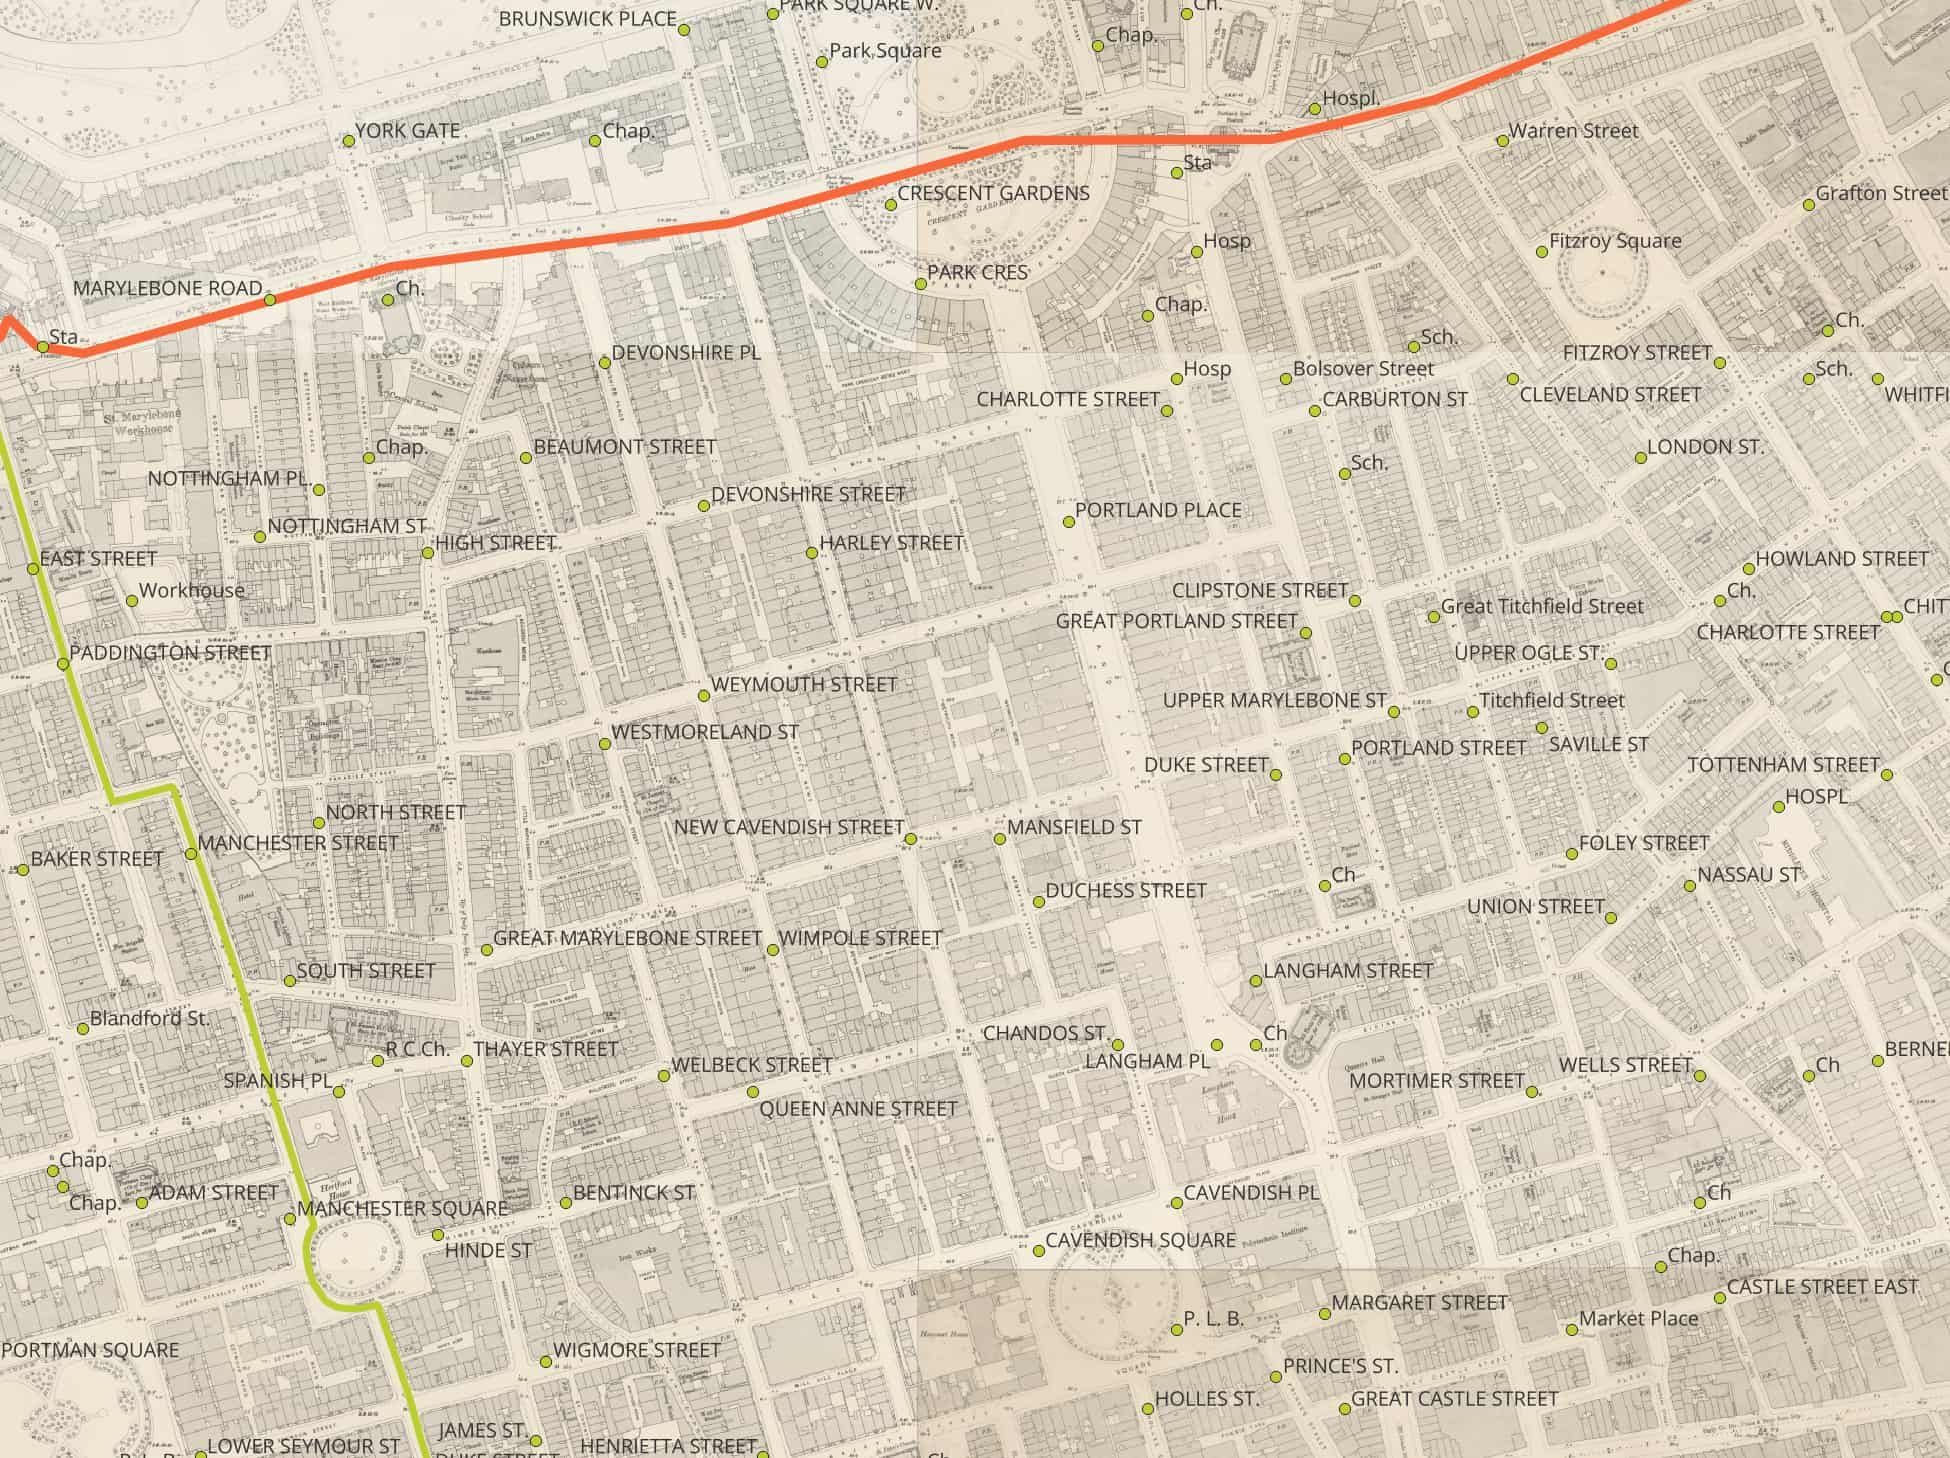
Aman Bhargava Bangalore India Data Visualization Designer & Developer aman@diagramchasing.fun

#maps

11 posts tagged with "maps"

← Back to all notes

#maps Tagged Posts

Nov 7, 2025 Note

Based on an analysis of the history and current state of migration flow mapping, drawn from very diverse sources – scientific, artistic, activist – and from different geographical contexts at various scales, we propose to analyze some of the main technical, ethical, institutional and political challenges of the cartographic representation of international migrations.

From a critical perspective, we will analyze both the role of mapping in the production of knowledge and understanding in the field of migration, and its potential for social and political transformation.

One of our regular clients at Revisual Labs has been the UN International Organization for Migration (UN IOM). My very first project at RVL was an IOM project and one of my favorite work projects last year was Journeys of Resilience, a story that traced the movements of Ukrainian refugees as a result of the war. Mapping migration is a consistent theme and this article, originally in French, made me think about some of the choices I’ve been making as well as the standard representations of such a fundamentally human and qualitative subject. Sometimes in dataviz, you kind of go by the “industry defaults” for certain topics. Nearly every story in NYT or Reuters and in other outlets has the same kind of map for migrations, one of which might have big arrows showing the direction of movement from one place to other and while you’re making your own map, you go with these defaults in mind. Those defaults may not be bad, but it is worth thinking reflecting on some of those decisions in a larger context, which is what this article offers. Your browser should be able to translate the original text for you.

Update: There is an English translation of this article here.

Mapping migratory movements necessarily involves " freezing " a system that is embedded in space and time, within a complex social and political context. This is a real challenge because not only do people migrating and/or on the path to exile cross paths, but they also take " breaks ," of varying lengths, settling temporarily in a country or place, staying for a few days, a few weeks, or a few years, and sometimes leaving again.

The complexity of these dynamic routes, which defy geography and migration mapping, must then adapt to often very rapid political and temporal changes. This is why mapping always risks being anachronistic even before the map is finished.

Permalink Aman Bhargava
0
Oct 16, 2025 Bookmark

HOLC’s infamous residential security maps usefully highlight the relationships between race and value that were articulated in the landscape through projects like the Newtown Pike extension project. It is often tempting to correlate redlining with a great many modern social problems. Doing so, however, risks ignoring the many other histories and geographies that have accumulated in the margins of those striking splashes of red—lives lived, neighborhoods changed, and roads that leave a mark even before they are built.

Permalink Aman Bhargava
0
Sep 22, 2025 Bookmark

Transitioning to orthographic view is so trippy! Orthographic view from the top gives you the standard isometric feel, but try panning and rotating the viewer to view cities like New York from the sides; completely new perspectives and feel.

It is pretty cool that you can do this outside of the Google Earth interface now, even if the Google logo remains.

Permalink Aman Bhargava
0
Sep 2, 2025 Bookmark

Over the last three years, as a part of the Sustainable Mobility Network, Sensing Local, along with other partners, developed the Urban Revamp Design Challenge (https://sensinglocal.wixsite.com/urbanrevamp), which invited design proposals from Architects to re-imagine under-utilised public spaces in Bengaluru, supported by active citizen groups in the neighbourhood. Two successive competitions resulted in 70 design proposals for 4 sites.

Great map of public spaces in Bangalore by Sensing Local. Categorized under labels such as food streets, places under metro lines and flyovers, walker streets and so on, I think it would be neat to have a Slow Routes type routing map that optimizes for pedestrian friendly features on OSM and takes you through some of these POIs. At a high-level I understand that this is an orienteering problem.

h/t Vonter for sharing.

Permalink Aman Bhargava
21
Aug 30, 2025 Photo

Short day out with Aditya. We visited the BLR Reads exhibition at the MOD Design Foundation office in Church Street, mostly with the intention of introducing him to this new space. To quote him looking out the 6th floor window onto the street corner, a view of this street that we rarely see, he said, “Man, this feels like a city.”

The space is interesting, they have a lot of old maps of the city which are worth seeing physically (there is, of course, https://blryesterday.com by my friend Vonter). The library is nice, it had books beyond those about Bangalore. I was pleasantly surprised to find ‘Sherlock Holmes’ London’ on one of the shelves. The membership is relatively inexpensive and I might consider it for a few months.

Capped the day with some Slay Coffee which reminds me of Yelli.

Permalink Aman Bhargava
18
Aug 23, 2025 Bookmark

Lotssssss of free OSM basemap servers with previews to show how they look, most of which are free. This is for the contextily python library but all of them come with details for the XYZ tiles, for example:

url:	https://data.geopf.fr/wmts?SERVICE=WMTS&VERSION=1.0.0&REQUEST=GetTile&STYLE={style}&TILEMATRIXSET={TileMatrixSet}&FORMAT={format}&LAYER={variant}&TILEMATRIX={z}&TILEROW={y}&TILECOL={x}

Related: https://leaflet-extras.github.io/leaflet-providers/preview/

Permalink Aman Bhargava
10
Jan 20, 2025 Bookmark

I spend a lot of time at the IKEA in Bangalore since the restaurant is great to work from, but I rarely, if ever, actually wander through the store. The store's lack of windows and the general sameness of the environment has confused me many times and until very late, I was not aware of the shortcuts I could take to get out faster.

Experienced IKEA shoppers may have noticed ‎that the shortcuts change over time. This is to prevent too many consumers from learning about and using them. And as part of the general retail principle of changing up

the layout to keep repeat shoppers stimulated\

....\

The new IKEA line map dispenses with reality altogether – it is a purely abstract one dimensional representation of an intensely non-linear, two dimensional space. As a result, trans‎posing the map to the physical reality of the store now requires significant mental effort. Hence most shoppers give up and stick to the flow of the shopping path.

The author makes some valid points, but perhaps I wasn't the audience this was written for because whenever I do roam the store, I love to do it. But it still has some great observations about wayfinding and the use of maps within the stores (I also didn't know that the general layout is almost the same for every IKEA).

Permalink Aman Bhargava
0
Jan 19, 2025 Bookmark

I recently discovered the David Rumsey map archives and spent an hour or two looking through all the various tags and keywords. These maps and charts by Survey of India, mostly from 1895, are fascinating. The visualizations are clear, the maps are well-designed, and it is a pleasure to browse through. Not to be one to hark back to the supposed greatness of the past, but this is clearly leagues better than the kind of work we see come out of government publications today.

Permalink Aman Bhargava
0
Jan 17, 2025 Bookmark

They have a habit to ask conductor about bus timings, and my map did not mention the timings- Instead of asking "does this bus goes to XYZ stand?" people ask "What bus is this?" followed by various questions. Most of the time the driver and conductor answered but when they are busy or tensed they tell people to ask their queries at the enquiry window.


We've been discussing making schematized, London-style spider-maps for BMTC bus routes over on the Bengwalk discord (which I definitely recommend joining if you live in Bangalore and are interested in public transportation) and that has sent me into a rabbit-hole of learning about octilinear, hexilinear and all those other kinds of transit maps. Professor Mundar Rane's (IDC) blog is quite a nice find for me, and this particular post discusses their process and observations on making such a bus map for Pune. It's easy to get caught up in the tech and design of things while missing things like the questions above because we take that for granted. Good read.

Permalink Aman Bhargava
0